Pericentrosomal localization of the TIG3 tumor suppressor requires an N-terminal hydrophilic region motif
- PMID: 24401997
- PMCID: PMC3989452
- DOI: 10.1038/jid.2013.533
Pericentrosomal localization of the TIG3 tumor suppressor requires an N-terminal hydrophilic region motif
Abstract
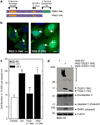
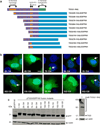
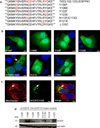
Tazarotene-induced gene 3 (TIG3) is a tumor suppressor protein that has a key role in controlling cell proliferation. TIG3 is observed at reduced levels in epidermal squamous cell carcinoma, and the restoration of expression in skin cancer cells reduces cell survival. TIG3 suppresses cell survival through mechanisms that involve localization at the plasma membrane and at the centrosome. TIG3 interacts at the plasma membrane to activate enzymes involved in keratinocyte terminal differentiation, and at the centrosome to inhibit daughter centrosome separation during mitosis leading to cessation of cell proliferation and induction of apoptosis. An important goal is identifying the motifs required for TIG3 localization at these intracellular sites as a method to understand the function of TIG3 at each location. TIG3 encodes an N-terminal hydrophilic region (amino acids 1-135) and a C-terminal membrane-anchoring domain (amino acids 135-164). We show that the C-terminal hydrophobic domain targets intact TIG3 to the plasma membrane, but when isolated as an independent element localizes at the mitochondria. We further demonstrate that a segment of the N-terminal hydrophilic region targets the centrosome. These studies provide important insights regarding the mechanisms that guide subcellular localization of this keratinocyte survival regulator.
Conflict of interest statement
The authors declare no conflict of interest.
Figures


Similar articles
-
TIG3: an important regulator of keratinocyte proliferation and survival.J Invest Dermatol. 2014 Jul;134(7):1811-1816. doi: 10.1038/jid.2014.79. Epub 2014 Mar 6. J Invest Dermatol. 2014. PMID: 24599174 Free PMC article. Review.
-
Localization of the TIG3 transglutaminase interaction domain and demonstration that the amino-terminal region is required for TIG3 function as a keratinocyte differentiation regulator.J Invest Dermatol. 2008 Mar;128(3):517-29. doi: 10.1038/sj.jid.5701035. Epub 2007 Aug 30. J Invest Dermatol. 2008. Retraction in: J Invest Dermatol. 2025 Jun;145(6):1541. doi: 10.1016/j.jid.2025.03.008. PMID: 17762858 Retracted.
-
TIG3 tumor suppressor-dependent organelle redistribution and apoptosis in skin cancer cells.PLoS One. 2011;6(8):e23230. doi: 10.1371/journal.pone.0023230. Epub 2011 Aug 17. PLoS One. 2011. PMID: 21858038 Free PMC article.
-
TIG3 interaction at the centrosome alters microtubule distribution and centrosome function.J Cell Sci. 2012 Jun 1;125(Pt 11):2604-14. doi: 10.1242/jcs.096495. Epub 2012 Mar 16. J Cell Sci. 2012. PMID: 22427689 Free PMC article.
-
TIG3: a regulator of type I transglutaminase activity in epidermis.Amino Acids. 2009 Apr;36(4):739-46. doi: 10.1007/s00726-008-0123-9. Epub 2008 Jul 9. Amino Acids. 2009. PMID: 18612777 Free PMC article. Review.
Cited by
-
Protein Dynamics Influence the Enzymatic Activity of Phospholipase A/Acyltransferases 3 and 4.Biochemistry. 2021 Apr 20;60(15):1178-1190. doi: 10.1021/acs.biochem.0c00974. Epub 2021 Mar 22. Biochemistry. 2021. PMID: 33749246 Free PMC article.
-
The HRASLS (PLA/AT) subfamily of enzymes.J Biomed Sci. 2015 Oct 26;22:99. doi: 10.1186/s12929-015-0210-7. J Biomed Sci. 2015. PMID: 26503625 Free PMC article. Review.
-
Phospholipase A and acyltransferase 4/retinoic acid receptor responder 3 at the intersection of tumor suppression and pathogen restriction.Front Immunol. 2023 Mar 31;14:1107239. doi: 10.3389/fimmu.2023.1107239. eCollection 2023. Front Immunol. 2023. PMID: 37063830 Free PMC article. Review.
-
TIG3: an important regulator of keratinocyte proliferation and survival.J Invest Dermatol. 2014 Jul;134(7):1811-1816. doi: 10.1038/jid.2014.79. Epub 2014 Mar 6. J Invest Dermatol. 2014. PMID: 24599174 Free PMC article. Review.
-
RARRES3 suppressed metastasis through suppression of MTDH to regulate epithelial-mesenchymal transition in colorectal cancer.Am J Cancer Res. 2015 May 15;5(6):1988-99. eCollection 2015. Am J Cancer Res. 2015. PMID: 26269758 Free PMC article.
References
-
- Akiyama H, Hiraki Y, Noda M, et al. Molecular cloning and biological activity of a novel Ha-Ras suppressor gene predominantly expressed in skeletal muscle, heart, brain, and bone marrow by differential display using clonal mouse EC cells, ATDC5. J Biol Chem. 1999;274:32192–32197. - PubMed
-
- Deucher A, Nagpal S, Chandraratna RA, et al. The carboxy-terminal hydrophobic domain of TIG3, a class II tumor suppressor protein, is required for appropriate cellular localization and optimal biological activity. Int J Oncol. 2000;17:1195–1203. - PubMed
-
- Doxsey S, Zimmerman W, Mikule K, et al. Centrosome control of the cell cycle. Trends Cell Biol. 2005;15:303–311. - PubMed
Publication types
MeSH terms
Substances
Grants and funding
LinkOut - more resources
Full Text Sources
Other Literature Sources
Medical

