

Lean mass asymmetry influences force and power asymmetry during jumping in collegiate athletes
- PMID: 24402449
- PMCID: PMC4370170
- DOI: 10.1519/JSC.0000000000000367
Lean mass asymmetry influences force and power asymmetry during jumping in collegiate athletes
Abstract
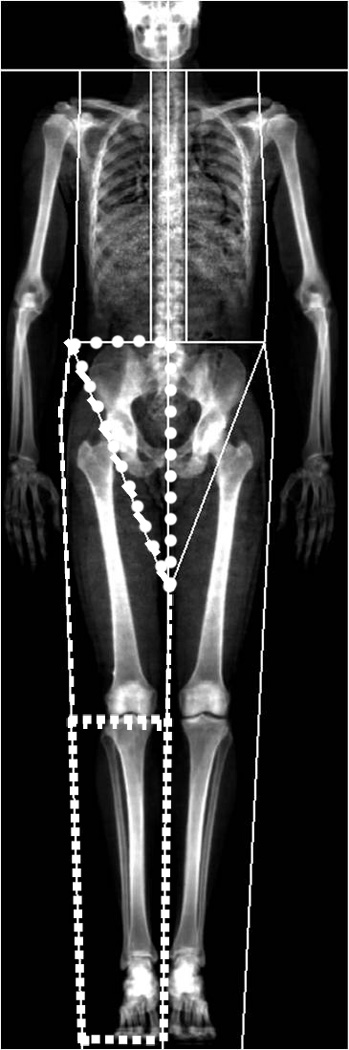
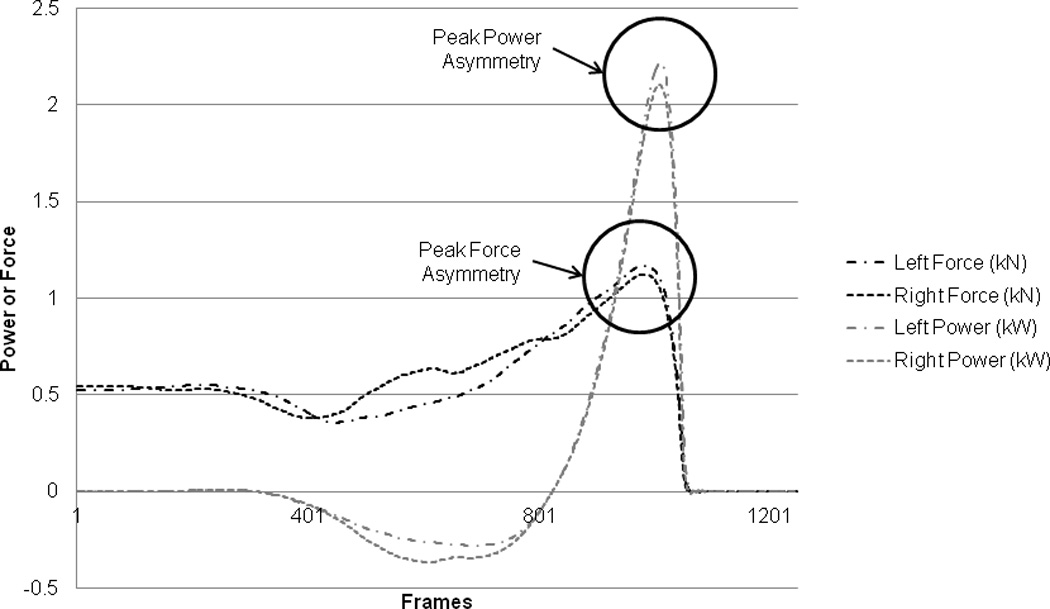
The purpose of this investigation was to (a) examine how asymmetry in lower extremity lean mass influenced force and power asymmetry during jumping, (b) determine how power and force asymmetry affected jump height, and (c) report normative values in collegiate athletes. Force and power were assessed from each limb using bilateral force plates during a countermovement jump in 167 division 1 athletes (mass = 85.7 ± 20.3 kg, age = 20.0 ± 1.2 years; 103 men and 64 women). Lean mass of the pelvis, thigh, and shank was assessed using dual-energy x-ray absorptiometry. Percent asymmetry was calculated for lean mass at each region (pelvis, thigh, and shank) as well as force and power. Forward stepwise regressions were performed to determine the influence of lean mass asymmetry on force and power asymmetry. Thigh and shank lean mass asymmetry explained 20% of the variance in force asymmetry (R = 0.20, p < 0.001), whereas lean mass asymmetry of the pelvis, thigh, and shank explained 25% of the variance in power asymmetry (R = 0.25, p < 0.001). Jump height was compared across level of force and power asymmetry (p > 0.05) and greater than 10% asymmetry in power tended to decrease the performance (effect size >1.0). Ninety-five percent of this population (2.5th to 97.5th percentile) displayed force asymmetry between -11.8 and 16.8% and a power asymmetry between -9.9 and 11.5%. A small percentage (<4%) of these athletes displayed more than 15% asymmetry between limbs. These results demonstrate that lean mass asymmetry in the lower extremity is at least partially responsible for asymmetries in force and power. However, a large percentage remains unexplained by lean mass asymmetry.
Figures
References
-
- Baim S, Wilson CR, Lewiecki EM, Luckey MM, Downs RW, Jr, Lentle BC. Precision assessment and radiation safety for dual-energy X-ray absorptiometry: position paper of the International Society for Clinical Densitometry. J Clin Densitom. 2005;8:371–378. - PubMed
-
- Benjanuvatra N, Lay BS, Alderson JA, Blanksby BA. Comparison of ground reaction force asymmetry in one- and two-legged countermovement jumps. J Strength Cond Res. 2013;27:2700–2707. - PubMed
-
- Buehring B, Krueger D, Binkley N. Jumping mechanography: a potential tool for sarcopenia evaluation in older individuals. J Clin Densitom. 2010;13:283–291. - PubMed
-
- Ceroni D, Martin XE, Delhumeau C, Farpour-Lambert NJ. Bilateral and gender differences during single-legged vertical jump performance in healthy teenagers. J Strength Cond Res. 2012;26:452–457. - PubMed
Publication types
MeSH terms
Grants and funding
LinkOut - more resources
Full Text Sources
Other Literature Sources
