

Simultaneous identification of growth law and estimation of its rate parameter for biological growth data: a new approach
- PMID: 24402566
- PMCID: PMC3923958
- DOI: 10.1007/s10867-013-9336-6
Simultaneous identification of growth law and estimation of its rate parameter for biological growth data: a new approach
Abstract
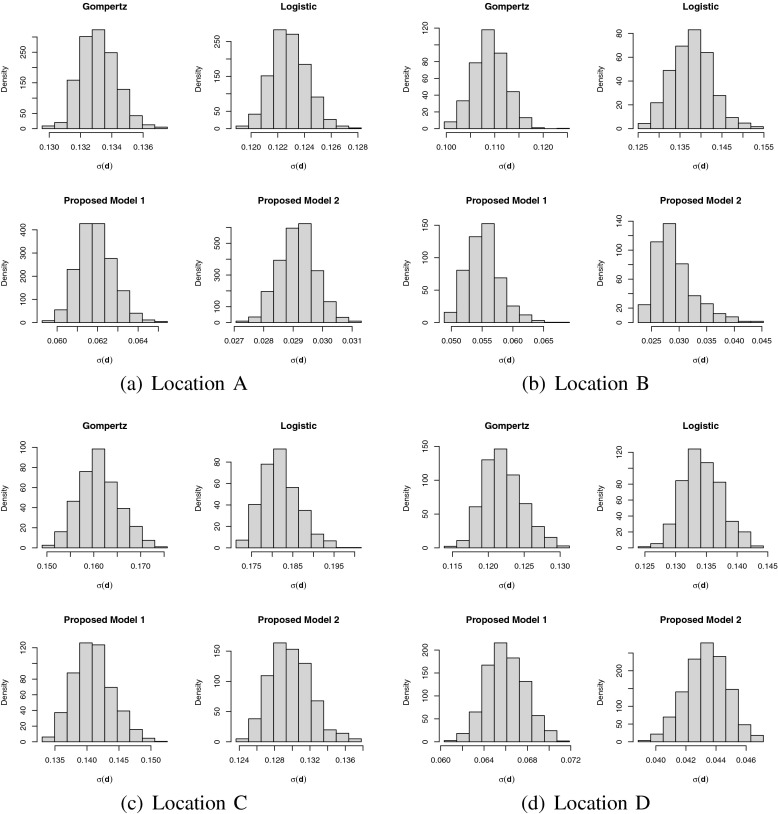
Scientific formalizations of the notion of growth and measurement of the rate of growth in living organisms are age-old problems. The most frequently used metric, "Average Relative Growth Rate" is invariant under the choice of the underlying growth model. Theoretically, the estimated rate parameter and relative growth rate remain constant for all mutually exclusive and exhaustive time intervals if the underlying law is exponential but not for other common growth laws (e.g., logistic, Gompertz, power, general logistic). We propose a new growth metric specific to a particular growth law and show that it is capable of identifying the underlying growth model. The metric remains constant over different time intervals if the underlying law is true, while the extent of its variation reflects the departure of the assumed model from the true one. We propose a new estimator of the relative growth rate, which is more sensitive to the true underlying model than the existing one. The advantage of using this is that it can detect crucial intervals where the growth process is erratic and unusual. It may help experimental scientists to study more closely the effect of the parameters responsible for the growth of the organism/population under study.
Figures


Similar articles
-
A new growth curve model for biological growth: some inferential studies on the growth of Cirrhinus mrigala.Math Biosci. 2014 Aug;254:28-41. doi: 10.1016/j.mbs.2014.06.004. Epub 2014 Jun 14. Math Biosci. 2014. PMID: 24933474
-
Evolution of model specific relative growth rate: Its genesis and performance over Fisher's growth rates.J Theor Biol. 2018 May 7;444:11-27. doi: 10.1016/j.jtbi.2018.02.012. Epub 2018 Feb 13. J Theor Biol. 2018. PMID: 29452171
-
Taylor's power law of fluctuation scaling and the growth-rate theorem.Theor Popul Biol. 2013 Sep;88:94-100. doi: 10.1016/j.tpb.2013.04.002. Epub 2013 May 17. Theor Popul Biol. 2013. PMID: 23689021
-
[Genetic aspects of genealogy].Genetika. 2011 Nov;47(11):1451-72. Genetika. 2011. PMID: 22332404 Review. Russian.
-
[Single-donor (apheresis) platelets and pooled whole-blood-derived platelets--significance and assessment of both blood products].Clin Lab. 2014;60(4):S1-39. doi: 10.7754/clin.lab.2014.140210. Clin Lab. 2014. PMID: 24779310 Review. German.
Cited by
-
Parameter estimation of the Solow-Swan fundamental differential equation.Heliyon. 2022 Sep 29;8(10):e10816. doi: 10.1016/j.heliyon.2022.e10816. eCollection 2022 Oct. Heliyon. 2022. PMID: 36212007 Free PMC article.
-
Understanding gold toxicity in aerobically-grown Escherichia coli.Biol Res. 2020 Jun 8;53(1):26. doi: 10.1186/s40659-020-00292-5. Biol Res. 2020. PMID: 32513271 Free PMC article.
-
Instantaneous maturity rate: a novel and compact characterization of biological growth curve models.J Biol Phys. 2022 Sep;48(3):295-319. doi: 10.1007/s10867-022-09609-9. Epub 2022 Jul 2. J Biol Phys. 2022. PMID: 35779141 Free PMC article.
-
A new framework for growth curve fitting based on the von Bertalanffy Growth Function.Sci Rep. 2020 May 14;10(1):7953. doi: 10.1038/s41598-020-64839-y. Sci Rep. 2020. PMID: 32409646 Free PMC article.
References
-
- Florio M, Colautti S. A logistic growth theory of public expenditures: A study of five countries over 100 years. Public Choice. 2005;122:355–393. doi: 10.1007/s11127-005-3900-y. - DOI
Publication types
MeSH terms
LinkOut - more resources
Full Text Sources
Other Literature Sources
