. 2014 Jan 8;34(2):418-33.
doi: 10.1523/JNEUROSCI.2712-13.2014.

Mutant LRRK2 toxicity in neurons depends on LRRK2 levels and synuclein but not kinase activity or inclusion bodies

Affiliations

Mutant LRRK2 toxicity in neurons depends on LRRK2 levels and synuclein but not kinase activity or inclusion bodies

Gaia Skibinski et al. J Neurosci. .

Abstract

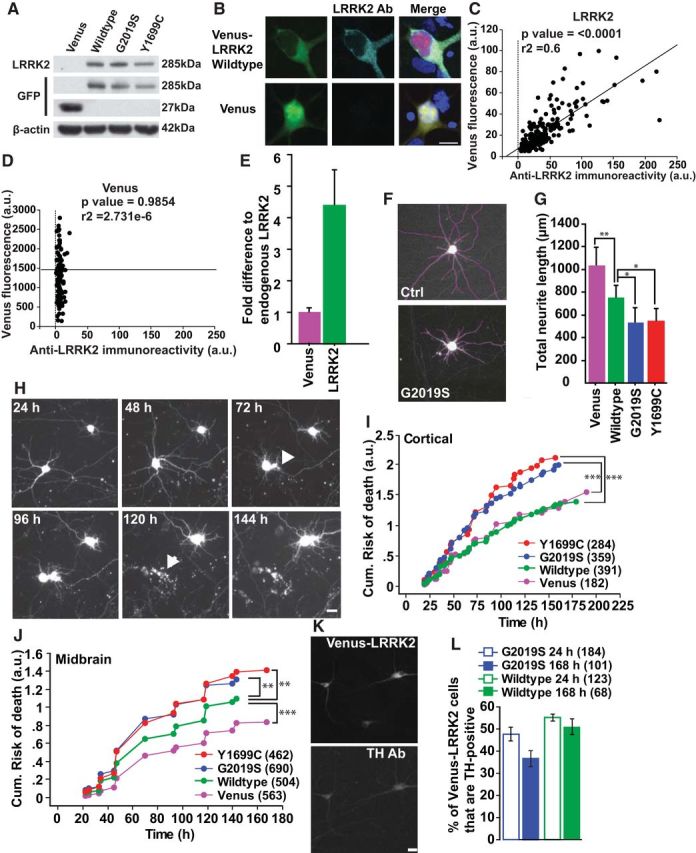
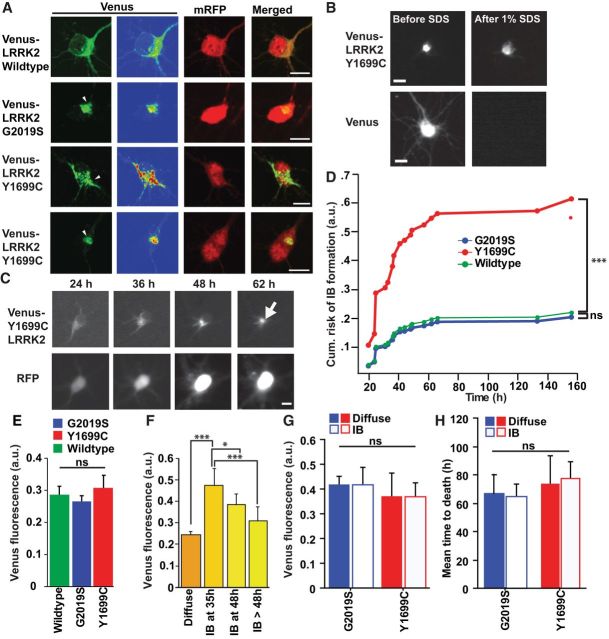
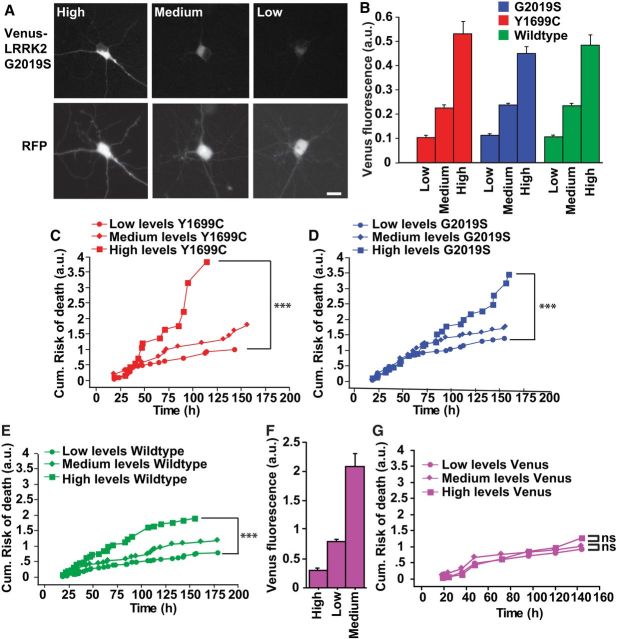
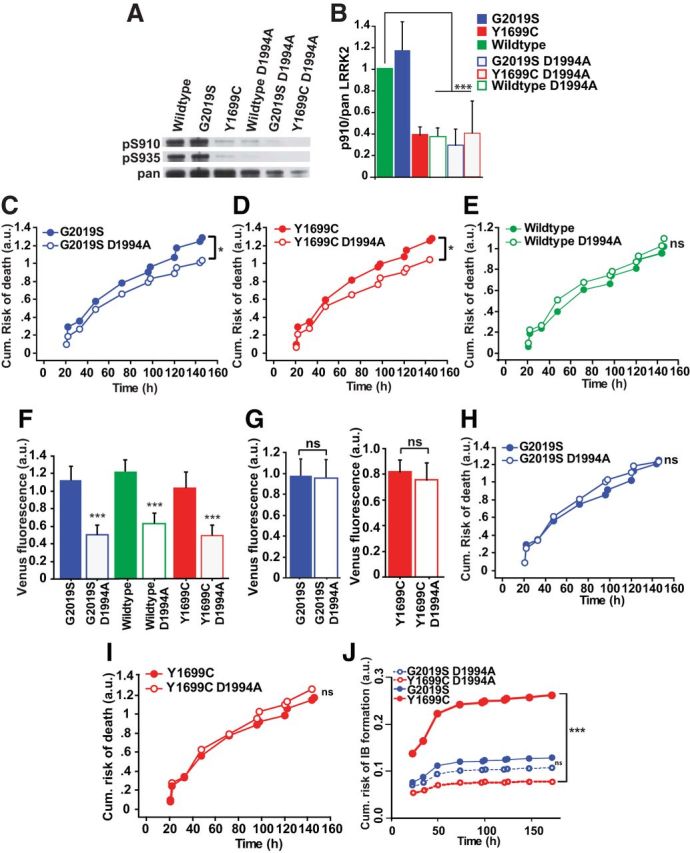
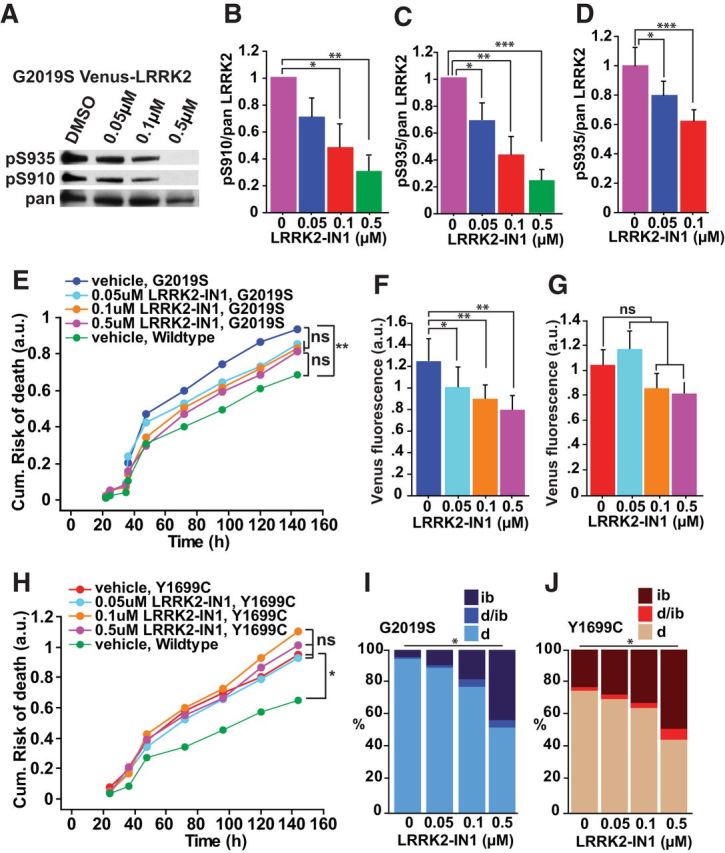
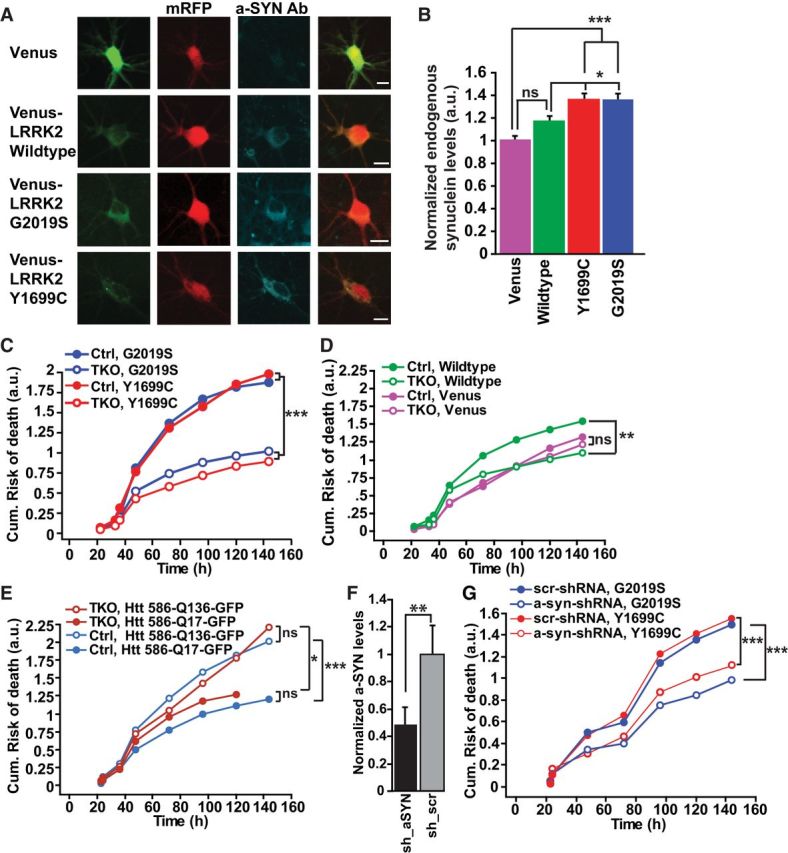
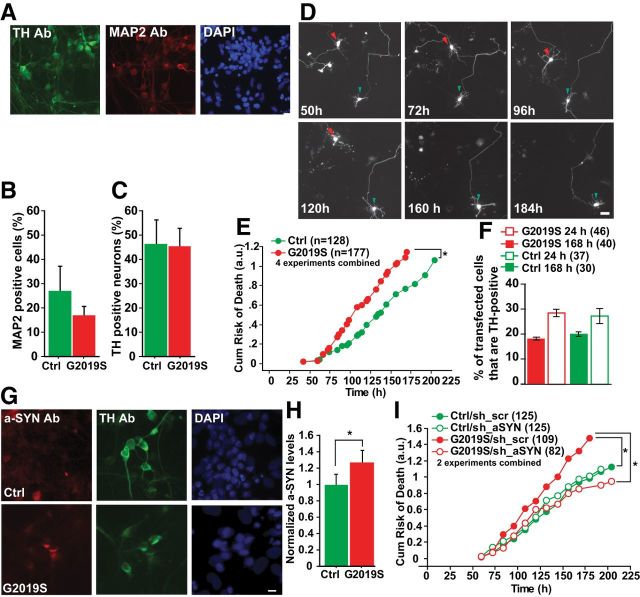
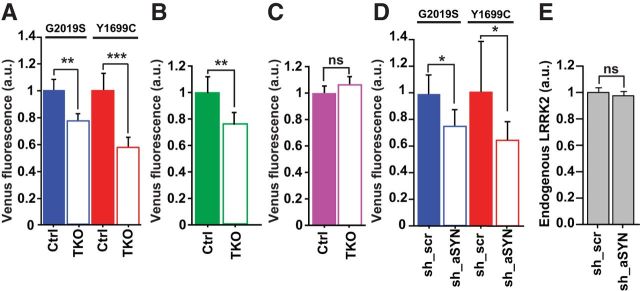
By combining experimental neuron models and mathematical tools, we developed a "systems" approach to deconvolve cellular mechanisms of neurodegeneration underlying the most common known cause of Parkinson's disease (PD), mutations in leucine-rich repeat kinase 2 (LRRK2). Neurons ectopically expressing mutant LRRK2 formed inclusion bodies (IBs), retracted neurites, accumulated synuclein, and died prematurely, recapitulating key features of PD. Degeneration was predicted from the levels of diffuse mutant LRRK2 that each neuron contained, but IB formation was neither necessary nor sufficient for death. Genetic or pharmacological blockade of its kinase activity destabilized LRRK2 and lowered its levels enough to account for the moderate reduction in LRRK2 toxicity that ensued. By contrast, targeting synuclein, including neurons made from PD patient-derived induced pluripotent cells, dramatically reduced LRRK2-dependent neurodegeneration and LRRK2 levels. These findings suggest that LRRK2 levels are more important than kinase activity per se in predicting toxicity and implicate synuclein as a major mediator of LRRK2-induced neurodegeneration.

Keywords: LRRK2; Parkinson's disease; mechanisms; single cell; synuclein.


Figures

Figure 1.
Figure 1.
A neuron model that recapitulates key features of PD, including neurite degeneration and cell loss. A, Representative Western blots of transfected HEK293 cell lysates show expression of full-length Venus-tagged LRRK2 blotted with antibodies raised against LRRK2 or GFP (recognizes Venus). β-Actin was blotted as a loading control. B, Confocal images of neurons overexpressing wild-type Venus-LRRK2 and stained with LRRK2 antibody. Cells were fixed 48 h post-transfection at 7 DIV. C, Linear regression analysis showing that single-neuron levels of diffuse wild-type Venus-LRRK2 fluorescence correlate with measurements taken by immunocytochemistry with a LRRK2 antibody. More than 150 neurons, two experiments combined, linear regression analysis, p < 0.0001, r2 = 0.6. D, Linear regression analysis of fluorescence measurements from neurons expressing Venus alone. There is no correlation with LRRK2 immunofluorescence. More than 150 neurons, two experiments combined, linear regression analysis, p = n.s. and r2 = 2.731e−6. E, Histogram showing that neurons transfected with wild-type Venus-LRRK2 have LRRK2 levels approximately fivefold greater than neurons expressing just Venus based on measurements taken by immunocytochemistry with a LRRK2 antibody (>50 neurons). F, Representative traces (purple lines) of neuronal processes from images of neurons cotransfected with Venus or mutant Venus-LRRK2 and mRFP. Venus-only transfected neurons were used as controls (Ctrl). At 48 h post-transfection, mRFP images were used to trace and quantify the total number and lengths of neuronal processes. G, Average total neurite length was significantly lower in neurons transfected with the PD-associated LRRK2 mutants than in neurons expressing wild-type Venus-LRRK2 or Venus alone. Neurons expressing wild-type LRRK2 also had shorter neurites than Venus-expressing neurons. More than 65 neurons in each group, two experiments combined, one-way ANOVA with Fisher's PLSD post hoc tests, **p < 0.001, *p < 0.05; F = 13.2. Error bars are 95% confidence intervals. H, Longitudinal imaging of two neurons expressing mRFP and wild-type Venus-LRRK2. The top neuron remains alive throughout the imaging period. The bottom neuron underwent neurite degeneration at 72 h (arrowhead) and then died by 120 h (arrow). Neurons were 5 DIV at initiation of tracking. Scale bars, 10 μm. I, J, Primary cortical (I) or postnatally derived midbrain (J) neurons expressing LRRK2 mutants G2019S and Y1699C have a significantly greater cumulative risk-of-death than neurons expressing wild-type LRRK2. Neurons per group specified in brackets on the figures, ≥3 experiments combined, log rank test, **p < 0.001, ***p < 0.0001. K, Representative images of midbrain neurons transfected with wild-type Venus-LRRK2 and stained with TH 48 h later. Neurons are 5–6 DIV at time of transfection. Scale bar, 10 μm. L, Histogram showing the percentage of LRRK2-expressing neurons that are TH-positive at 24 or 168 h post-transfection. Neurons expressing mutant LRRK2 G2019S trended toward a lower percentage of TH-positive neurons at 7 d. The number of neurons in each group ranged from 65 to 184, three independent experiments combined, one-way ANOVA with Fisher's PLSD post hoc tests; p = 0.173, F = 1.805. Error bars are 95% confidence intervals.
Figure 2.
Figure 2.
IB formation depends on the PD-associated LRRK2 mutation and LRRK2 levels, but is not required for LRRK2-dependent cell death. A, Confocal images of primary cortical neurons overexpressing wild-type Venus-LRRK2 show diffuse cytosolic LRRK2 expression. Expression of PD-associated mutants G2019S or Y1699C LRRK2 leads to the formation of heterogeneous cytosolic IBs (arrowheads). Neurons were fixed at 48 h post-transfection at 7 DIV. Scale bars, 10 μm. B, Detergent-resistance assay shows that IBs were resistant to treatment with 1% SDS/1% Triton X-100. Scale bar, 10 μm. C, Longitudinal imaging of a neuron expressing mRFP and mutant Y1699C Venus-LRRK2, undergoing IB formation (arrow). Neurons were 5 DIV at initiation of tracking. Scale bars, 10 μm. D, Cumulative risk-of-IB formation is greater in neurons expressing Y1699C Venus-LRRK2 than those expressing wild-type Venus-LRRK2 or G2019S Venus-LRRK2. More than 110 neurons per group, ≥3 experiments combined, using a semiparametric proportional hazards model, that incorporates the presence of competing risk events, ***p < 0.0001. E, Neurons expressing wild-type, G2019S, or Y1699C Venus-LRRK2 had similar Venus-LRRK2 levels. Number of neurons for Y1699C = 121, G2019S = 308, and wild-type = 283, three experiments combined, Fisher's PLSD post hoc tests, not significant (ns). Error bars are 95% confidence intervals. F, Neurons that did not form IBs had significantly lower LRRK2 levels than neurons that formed LRRK2 IBs by 35, 48, or after 48 h. More than 32 neurons in each group, three experiments combined, one-way ANOVA with Fisher's PLSD post hoc tests, *p < 0.01, ***p < 0.0001; F = 36.71. Error bars are 95% confidence intervals. G, Venus-LRRK2 levels are matched in cohorts of neurons expressing G2019S and Y1699C Venus-LRRK2. H, In neurons expressing G2019S or Y1699C Venus-LRRK2, the average time-to-death in neurons that form an IB at 36–48 h is similar to the average time-of-death in neurons without an IB. More than 40 neurons per group, three experiments combined, one-way ANOVA with Fisher's PLSD post hoc tests. Error bars are 95% confidence intervals.
Figure 3.
Figure 3.
Higher levels of venus-LRRK2 are more toxic. A, Representative images of primary neurons expressing different levels of G2019S Venus-LRRK2. In each neuron, a quantitative measure of LRRK2 is made using the Venus-LRRK2 fluorescence. Scale bar, 10 μm. B, Average levels of Venus-LRRK2 after neurons were split into separate cohorts expressing low, medium, or high LRRK2 levels. Error bars are 95% confidence intervals. C–E, Neurons expressing higher levels of Y1699C Venus-LRRK2, G2019S Venus-LRRK2, or wild-type Venus-LRRK2 have a greater cumulative risk-of-death than neurons expressing lower levels. Number of neurons for Y1699C = 157, G2019S = 345 neurons, and wild-type = 400 neurons, ≥3 experiments combined, log rank test, ***p < 0.0001. F, Cohorts of neurons expressing low, medium, and high levels of Venus. Error bars are 95% confidence intervals. G, In neurons expressing higher, medium, or low levels of Venus there is no difference in the cumulative risk-of-death. Number of neurons, >180, ≥3 experiments, log-rank test.
Figure 4.
Figure 4.
Kinase-inactivating mutations reduce mutant LRRK2-induced toxicity by reducing LRRK2 levels. A, Representative Western blots of lysates from HEK293 cells transfected with wild-type, G2019S, or Y1699C Venus-LRRK2 constructs with or without the D1994A mutation and immunoblotted for the detection of LRRK2 phosphorylation at Ser910 (top) and Ser935 (middle), and total LRRK2 (pan LRRK2, bottom). B, Quantification of phosphorylated LRRK2 at Ser910 normalized to total pan LRRK2. Three independent experiments combined, Mann–Whitney test, wild-type versus wild-type D1994A (S910 ***p = 0.0495; Z = 1.964), G2019S vs G2019S D1994A (S910 ***p = 0.0495, Z = 1.964), Y1699C versus Y1699C D1994A (S910 p = 0.8273; Z = 0.218). Error bars indicate the SD. C, D, Before controlling for LRRK2 levels, cumulative risk-of-death curves show that the D1994A mutation led to a significant reduction in toxicity in neurons expressing the mutant G2019S and Y1699C Venus-LRRK2; number of neurons for G2019S = 181, G2019S D1994A = 283, Y1699C = 354, and Y1699C D1994A = 260, three experiments combined, log rank test, *p < 0.01. E, Graph showing no significant difference in the survival of neurons expressing wild-type Venus-LRRK2 with or without the D1994A mutation. Number of neurons for wild-type = 392 and wild-type D1994A = 277, three experiments combined, log rank test. F, Average expression levels of LRRK2 constructs with or without the D1994A mutation in primary neurons. Number of neurons as in C, D, three experiments combined, one-way ANOVA with Fisher's PLSD post hoc tests, ***p < 0.0001; F = 22.91. Error bars are 95% confidence intervals. G, Neurons expressing mutant Y1699C or G2019S Venus-LRRK2 with or without the D1994A mutation were matched for LRRK2 levels. Number of neurons for G2019S = 170, G2019S D1994A = 138, Y1699C = 297, and Y1699C D1994A = 166, three experiments combined. H, I, After matching for LRRK2 levels, cumulative risk-of-death curves show neurons expressing Y1699C and G2019S with or without D1994A exhibit no significant difference in toxicity. Number of neurons as in G, three experiments combined, log rank test. J, Before controlling for LRRK2 levels, cumulative risk-of-IB formation curves show that the D1994A mutation significantly reduces the risk-of-IB formation of mutant Y1699C, but not mutant G2019S. Number of neurons for G2019S and G2019S D1994A (449) and for Y1699C and Y1699C D1994A (565), three experiments combined, using a semiparametric proportional hazards model that incorporates the presence of competing risk events, ***p < 0.0001.
Figure 5.
Figure 5.
Pharmacological inhibition of LRRK2 kinase activity reduces LRRK2 toxicity by modulating IB formation and LRRK2 levels. A, Western blot of HEK293 cell lysates transfected with G2019S Venus-LRRK2, treated with DMSO or increasing concentrations of LRRK2-IN1 for 2 h, and extracted for immunoblotting to detect LRRK2 phosphorylation at Ser910 (top) and Ser935 (middle), and total LRRK2 (bottom). B, C, Western blot analysis was used to take measurements of LRRK2 phosphorylation at Ser910 and Ser935 normalized against total LRRK2. Three experiments combined, Mann–Whitney test, 0 μm versus 0.05 μm (S910 and S935 p = 0.0495; Z = 1.964), 0 μm versus 0.1 μm (S910 and S935 p = 0.0495; Z = 1.964), 0 μm versus 0.5 μm (S910 and S935 p = 0.025; Z = 2.236). Error bars indicate SD of the mean. D, Immunocytochemistry measurements of LRRK2 phosphorylation at Ser935 normalized against total LRRK2, from individual rat cortical neurons overexpressing G2019S Venus-LRRK2. More than 30 neurons per group, one-way ANOVA with Fisher's PLSD post hoc tests, *p < 0.01, ***p < 0.0001; F = 14.579. Error bars indicate 95% confidence intervals. E, Application of increasing concentrations of LRRK2-IN-1 trends towards a reduction in the cumulative risk-of-death of neurons expressing mutant G2019S LRRK2. Number of neurons for vehicle = 295, 0.05 μm = 292, 0.1 μm = 345 and 0.5 μm = 321, three experiments combined, log rank test, **p < 0.01. F, G, Average Venus-LRRK2 levels measured in neurons with and without LRRK2-IN1 treatment. F, Increasing doses of LRRK2-IN1 caused a dose-dependent reduction in G2019S-Venus-LRRK2 levels and G, no significant difference was found with Y1699C Venus-LRRK2. Number of neurons same as E, H, three experiments combined, one-way ANOVA with Fisher's PLSD post hoc tests, G2019S (*p < 0.05, **p < 0.01; F = 4.659) and Y1699C (not significant (ns); F = 1.256). Error bars are 95% confidence intervals. H, Application of increasing concentrations of LRRK2-IN1 caused no difference in risk of death for mutant Y1699C-expressing neurons. Number of neurons for vehicle = 274, 0.05 μm = 222, 0.1 μm = 238, and 0.5 μm = 231, three experiments combined, log rank test, *p < 0.05. I, J, Bar graphs showing the percentage of cells with diffuse mutant G2019S or Y1699C LRRK2 expression (d), an IB (ib) or that do not have a clearly defined IB, but show signs of an IB precursor (d/ib) at 24 h post-transfection. Increasing concentrations of LRRK2-IN increase the percentage of neurons with IBs for both mutants. Number of neurons is same as above in E, H, three experiments combined, Kruskal–Wallis test, G2019S (*p = 0.042, H = 8.231) and Y1699C (*p = 0.038, H = 8.426).
Figure 6.
Figure 6.
Synuclein is required for mutant LRRK2-induced toxicity. A, Representative images of primary cortical neurons transfected with Venus, wild-type, or mutant Venus-LRRK2, fixed 24 h later and stained with α-synuclein. Neurons are 7 DIV. Scale bar, 10 μm. B, Average levels of endogenous α-synuclein (determined by anti-α-synuclein immunocytochemistry) in cortical neurons transfected with wild-type, Y1699C, or G2019S Venus-LRRK2. Values are normalized relative to α-synuclein levels in neurons expressing a Venus control. More than 100 neurons per group, four experiments combined, one-way ANOVA with Fisher's PLSD post hoc tests, *p < 0.05, ***p < 0.0001; F = 7.707. Error bars are 95% confidence intervals. C, Cumulative risk-of-death curves show that TKO neurons expressing Y1699C or G2019S had significantly lower toxicity than Ctrl neurons. More than 245 neurons per group, three experiments combined, log rank test, ***p > 0.0001. D, Cumulative risk-of-death curves show that TKO neurons expressing wild-type Venus-LRRK2 had significantly lower toxicity than Ctrl neurons. Ctrl and TKO neurons transfected with Venus control had no difference in survival. More than 180 neurons per group, three experiments combined, log rank test, **p < 0.001. E, Ctrl and TKO neurons transfected with mutant Htt586-Q136-GFP show no difference in toxicity in Ctrl or TKO neurons. More than 120 neurons per group, two experiments combined, log rank test, *p < 0.01, ***p > 0.0001. F, Quantification of shRNA knockdown of endogenous α-synuclein levels. Primary rat cortical neurons were transfected with shRNA against α-synuclein or shRNA scrambled control. Forty-eight hours after transfection cells were fixed and stained with α-synuclein. Neurons were 7 DIV when fixed. More than 34 neurons per group, two experiments combined, unpaired t test, **p < 0.001; t = 3.688. Error bars are 95% confidence intervals. G, Cumulative risk-of-death curves show that in rodent neurons knockdown of α-synuclein by transfection of shRNA constructs (a-syn-shRNA) significantly reduce mutant LRRK2 toxicity, compared with neurons transfected with scrambled shRNA (scr-shRNA). More than 150 neurons per group, three experiments combined, log rank test, ***p < 0.0001.
Figure 7.
Figure 7.
LRRK2 patient-derived neurons display α-synuclein-dependent toxicity. A, Representative images from immunocytochemistry of neurons differentiated from iPSCs from a control individual, costained with TH, MAP2, and DAPI. Scale bar, 20 μm. B, The percentage of neurons in the culture was calculated as the percentage of cells with MAP2 and DAPI overlap. C, The percentage of dopaminergic neurons was calculated as the percentage of MAP2-positive cells with colocalization of both MAP2 and TH staining. D, Longitudinal tracking of single neurons differentiated from iPSCs and transfected with a mApple-Map2 fluorescent reporter. The time of death is captured for each neuron that is followed. The cell indicated with a red arrowhead dies by 160 h. Degeneration of neurites was observed at 120 h and complete soma loss observed at 160 h. In contrast the neuron indicated by the green arrowhead, lives throughout the length of the experiment. Scale bar, 20 μm. E, Neurons derived from patients harboring the LRRK2 mutation G2019S had a greater risk-of-death than controls. Cells per group specified in brackets on the figure, four experiments combined, log rank test, *p < 0.05. F, Histogram showing the percentage of mApple-transfected neurons that are TH-positive at 24 or 168 h post-transfection. TH-positive neurons expressing mutant LRRK2 G2019S trended toward a lower percentage of TH-positive neurons at 6 d. Approximately 30–40 neurons in each group, two independent experiments combined, one-way ANOVA with Fisher's PLSD post hoc tests, p = 0.246; F = 1.563. Error bars are 95% confidence intervals. G, Representative images of TH-positive neurons derived from G2019S LRRK2 and control iPSCs indicate elevated endogenous α-synuclein staining in G2019S LRRK2 patient cells. Scale bar, 10 μm. H, Average levels of endogenous α-synuclein (determined by anti-α-synuclein immunocytochemistry) in TH-positive neurons are significantly higher in neurons differentiated from G2019S LRRK2 iPSCs compared with control iPSCs. Values are normalized relative to α-synuclein levels in control TH neurons. More than 100 neurons per group, three experiments combined, unpaired t test, *p < 0.01; t = 2.692. Error bars are 95% confidence intervals. I, Reducing α-synuclein levels in neurons derived from patients harboring the LRRK2 mutation G2019S caused a significant reduction in risk-of-death compared with those with a scrambled control shRNA. Reducing α-synuclein levels in neurons derived from unaffected individuals showed no significant difference in survival compared with those with a scrambled control shRNA. Brackets indicate cells per group, two experiments combined, log rank test, *p < 0.05.
Figure 8.
Figure 8.
Loss of α-synuclein reduces LRRK2 levels. A, Venus-LRRK2 levels of the Y1699C and G2019S LRRK2 mutants were significantly lower in TKO neurons than in Ctrl mouse neurons. Number of neurons for G2019S = 204, G2019S TKO = 251, Y1699C = 160, Y1699C TKO = 194, three experiments combined, one-way ANOVA with Fisher's PLSD post hoc tests, **p < 0.01, ***p < 0.0001; F = 8.674. Error bars are 95% confidence intervals. B, Histogram showing quantification of Venus-LRRK2 fluorescence in Ctrl and TKO neurons cotransfected with wild-type Venus-LRRK2. TKO neurons had significantly lower levels of Venus-LRRK2 as measured by Venus fluorescence. More than 271 neurons per group, three experiments combined, unpaired t test, **p < 0.002, t = 3.179. Error bars are 95% confidence intervals. C, In Ctrl and TKO neurons cotransfected with Venus, levels of Venus were unchanged. More than 188 neurons per group, three experiments combined, unpaired t test, p = 0.11, t = 1.6. Error bars are 95% confidence intervals. D, Venus-LRRK2 levels were also significantly lower in rat neurons with knockdown of endogenous α-synuclein (sh_aSYN) versus scrambled shRNA (sh_scr). Number of neurons G2019S/sh_scr = 185, G2019S/sh_aSYN = 160, Y1699C/sh_scr = 93, Y1699C/sh_aSYN = 147, two experiments combined, one-way ANOVA with Fisher's PLSD post hoc tests, *p < 0.05; F = 3.841. Error bars are 95% confidence intervals. E, Endogenous LRRK2 levels were unchanged in rat neurons with knockdown of endogenous α-synuclein (sh_aSYN) versus those with scrambled shRNA (sh_scr). Number of neurons sh_aSYN = 189, sh_scr = 180, three experiments combined, one-way ANOVA, p = 0.153; F = 2.056. Error bars are 95% confidence intervals.

References

    1. Abeliovich A, Schmitz Y, Fariñas I, Choi-Lundberg D, Ho WH, Castillo PE, Shinsky N, Verdugo JM, Armanini M, Ryan A, Hynes M, Phillips H, Sulzer D, Rosenthal A. Mice lackingα-synuclein display functional deficits in the nigrostriatal dopamine system. Neuron. 2000;25:239–252. doi: 10.1016/S0896-6273(00)80886-7. - DOI - PubMed
    1. Alegre-Abarrategui J, Christian H, Lufino MM, Mutihac R, Venda LL, Ansorge O, Wade-Martins R. LRRK2 regulates autophagic activity and localizes to specific membrane microdomains in a novel human genomic reporter cellular model. Hum Mol Genet. 2009;18:4022–4034. doi: 10.1093/hmg/ddp346. - DOI - PMC - PubMed
    1. Andersen PK, Gill RD. Cox's regression model for counting processes, a large sample study. Ann Statistics. 1982;10:1100–1120. doi: 10.1214/aos/1176345976. - DOI
    1. Andres-Mateos E, Mejias R, Sasaki M, Li X, Lin BM, Biskup S, Zhang L, Banerjee R, Thomas B, Yang L, Liu G, Beal MF, Huso DL, Dawson TM, Dawson VL. Unexpected lack of hypersensitivity in LRRK2 knock-out mice to MPTP (1-methyl-4-phenyl-1,2,3,6-tetrahydropyridine) J Neurosci. 2009;29:15846–15850. doi: 10.1523/JNEUROSCI.4357-09.2009. - DOI - PMC - PubMed
    1. Anwar S, Peters O, Millership S, Ninkina N, Doig N, Connor-Robson N, Threlfell S, Kooner G, Deacon RM, Bannerman DM, Bolam JP, Chandra SS, Cragg SJ, Wade-Martins R, Buchman VL. Functional alterations to the nigrostriatal system in mice lacking all three members of the synuclein family. J Neurosci. 2011;31:7264–7274. doi: 10.1523/JNEUROSCI.6194-10.2011. - DOI - PMC - PubMed

Publication types

MeSH terms

Substances