. 2014 Jan 8;34(2):515-26.
doi: 10.1523/JNEUROSCI.2441-13.2014.

Diverse thalamocortical short-term plasticity elicited by ongoing stimulation

Affiliations

Diverse thalamocortical short-term plasticity elicited by ongoing stimulation

Marta Díaz-Quesada et al. J Neurosci. .

Abstract

To produce sensation, neuronal pathways must transmit and process stimulus patterns that unfold over time. This behavior is determined by short-term synaptic plasticity (STP), which shapes the temporal filtering properties of synapses in a pathway. We explored STP variability across thalamocortical (TC) synapses, measuring whole-cell responses to stimulation of TC fibers in layer 4 neurons of mouse barrel cortex in vitro. As expected, STP during stimulation from rest was dominated by depression. However, STP during ongoing stimulation was strikingly diverse across TC connections. Diversity took the form of variable tuning to the latest interstimulus interval: some connections responded weakly to shorter intervals, while other connections were facilitated. These behaviors did not cluster into categories but formed a continuum. Diverse tuning did not require disynaptic inhibition. Hence, monosynaptic excitatory lemniscal TC connections onto layer 4 do not behave uniformly during ongoing stimulation. Each connection responds differentially to particular stimulation intervals, enriching the ability of the pathway to convey complex, temporally fluctuating information.


Figures
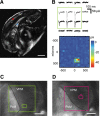
Figure 1.
Figure 1.
TC slice configuration and the origin of TC inputs to layer 4. A, TC slice configuration. bc, Barrel cortex; th, thalamus; h, hippocampus; str, striatum. Asterisks indicate typical sites for recording (red) and stimulation (blue). Scale bar, 1 mm. B, Top, Mean EPSC responses to laser-scanning photostimulation of 16 sites within a grid placed over the thalamic region of an example slice. Each trace depicts the average response at one stimulation site. The green rectangle demarcates the clearest synaptic inputs. Bottom, Color-coded input map for the full grid (18 × 18 sites); same example slice as in the top panel. The small green rectangle represents the region of origin of the clearest inputs (same as the green rectangle in the top panel). C, Thalamic stimulation region and region of origin of clearest inputs relative to VPM and PoM, same example slice as B. Large green square depicts full photostimulation grid from B, bottom, 1350 μm on the side; the small rectangle is the region of origin of clearest inputs, as in B. Scale bar, 500 μm. D, The thalamic stimulation region (large square) and the region of origin of clearest inputs (small polygon) for a layer 4 recording in a different slice. Thalamic inputs to layer 4 neurons originate in VPM. Scale bar, 500 μm.
Figure 2.
Figure 2.
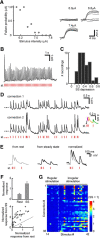
Diverse TC short-term plasticity elicited during ongoing stimulation. A, Protocol for setting stimulus amplitude. There was a clear distinction between failed and successful trials (with PSPs evoked at fixed latency). Stimulus amplitude was set at the minimum level that gave no stimulation failures. B, Example TC connection depresses under regular stimulation from rest. The stimulus train (st.) is shown at the bottom. C, Depression from rest to steady state (SS), computed for each recording as the ratio of steady-state PSP divided by initial PSP (also termed adaptation ratio), across the population (n = 38). D, Diverse behavior of two example connections after a switch from steady-state regular stimulation to an irregular train with identical average frequency (stimulation pattern shown at bottom). Inset shows magnified PSPs of connection 2 immediately after switch; different colors correspond to successive PSPs. Both synapses depressed following stimulation from rest. E, Responses of one connection to an irregular pattern after switching during ongoing activity, compared with responses of the same connection to the same pattern initiated from rest (after a pause of >5 s). Normalized, Responses normalized to first PSP peak in the pattern. Response facilitation became evident after prior depression. F, Top, Average normalized responses to short pulses in an identical irregular pattern, presented from rest or from steady state. PSP responses to the second and third stimuli in the pattern are averaged together and then normalized to the first PSP peak (as in E). Error bars indicate SEM (n = 38). Bottom, Scatter plot of normalized responses to short pulses in the same pattern from rest or after steady state (same data as top). Dashed line indicates identity. Prior depression enhanced facilitation. G, Diverse plasticity of PSP peaks across different connections. Stimulation was with a 42-pulse regular–irregular sequence as in D; plot begins at stimulus 14 in the sequence, while transition to the irregular train occurs at stimulus 22 (dashed line). Each row represents one connection (n = 38). For each connection, PSP peak magnitude is normalized to its value at steady state (left side of plot: s.s. = 1). Recordings (rows) are ordered from the smallest (top) to the largest (bottom) relative facilitation after the switch from regular to irregular stimulation.
Figure 3.
Figure 3.
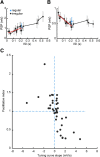
Population analysis of STP diversity. A, Tuning curve showing dependence of PSP magnitude on ISI for a connection whose responses are smaller for short ISIs. Black, Responses to irregular stimulus; blue (single data point), responses to regular stimulus; red, linear fit to initial (short-interval) part of tuning curve. Error bars indicate SEM. B, Tuning curve for a connection whose responses are larger for short ISIs. Note the similarity of black and blue values in both A and B, indicating tuning unaffected by whether the interval is within a regular or irregular train. C, Facilitation index (relative response after switch from regular to irregular stimulation) plotted against TCS across the population. Index is normalized such that 1 = no increase compared with steady state.
Figure 4.
Figure 4.
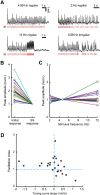
Diversity of STP under regular stimulation. A, Example responses to the different forms of stimulus sequence: regular stimulation with or without a switch to a different frequency (indicated above each trace) and regular-irregular stimulation. All responses are from the same recording. Stimulus patterns are shown under each trace. B, Comparison of initial and steady-state responses across the population recorded with regular stimulation (n = 24). Each connected pair of points (colored line) corresponds to one recording. For all connections, the response at steady state was smaller than the response from rest. C, Tuning curves for all recordings with regular stimulation at three different frequencies. Responses are normalized to the steady-state value at 4.59 Hz. Tuning was diverse, with a different slope for each neuron. D, Facilitation index (i.e., the relative response after the switch from regular to irregular stimulation) plotted against TCS obtained for regular stimulation, for all recordings. norm., Normalized; st., stimulus train; SS, steady state.
Figure 5.
Figure 5.
Negligible effect of inhibitory blockade on STP diversity. A, Verification of DNDS-mediated block of inhibition. I–V curves constructed from EPSC responses in voltage-clamp from two different neurons in the same slice, without (black) and with (green) DNDS in the internal solution. The slight difference in holding potential (Vh) among points at each nominal holding potential is caused by correction for the voltage drop across the series resistance. Note absence of synaptic response at the reversal potential for excitation (∼0 mV) with DNDS. B, Facilitation index plotted against TCS for experiments with and without DNDS in the recording pipette (control, n = 22; DNDS, n = 25). Note the similarity between the two distributions.
Figure 6.
Figure 6.
STP diversity across temperatures and extracellular [Ca2+]. A, Facilitation index plotted against TCS for experiments conducted at different temperatures and extracellular [Ca2+] values. Group sizes: n = 22 for [Ca2+] = 1 mm, temperature = 24°C; n = 16 for [Ca2+] = 1 mm, temperature = 32–34°C; n = 16 for [Ca2+] = 2 mm, temperature = 24°C; n = 16 for [Ca2+] = 2 mm, temperature = 32–34°C. Diversity occurred for all recording conditions. B, Central values across groups classified by recording condition. Consistent with a tendency toward depression, the mean facilitation index (post-switch response) was <1, and the median TCS was positive (compare with dashed lines). Error bars indicate SEM.
Figure 7.
Figure 7.
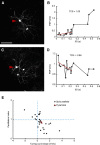
Diverse STP within recovered neurons. A, C, Two examples of spiny stellate neurons, fixed, recovered and observed under fluorescent microscopy. Arrowheads indicate somata of recorded neurons. Scale bar, 100 μm. B, D, Corresponding ISI tuning curves (black) and TCS (red). E, Facilitation index (i.e., the relative response after the switch from regular to irregular stimulation) plotted against TCS for the subset of recovered neurons. Note the considerable diversity within the population of identified spiny stellate neurons (n = 25).
Figure 8.
Figure 8.
STP diversity across conditions. A, Values for three sets of neurons (one quartet, one triplet, and one pair), each recorded within the same barrel in a slice, with the stimulating electrode fixed in position. B, Absence of correlation between facilitation index and age. Facilitation index plotted against postnatal age.
Figure 9.
Figure 9.
STP diversity can enrich information transmission in the TC pathway. The schematic shows different TC neurons within a VPM population (at left). These can encode distinct stimulus features and therefore respond at different times (reflected in the trains of PSPs corresponding to synaptic inputs from the three colored neurons). The green and blue neurons encode similar stimulus features and tend to respond in greater synchrony, while the red neuron tends to respond at different times. All three connect to a cortical neuron, at right. At certain moments, TC connections from both the green and blue neurons are strong enough to permit the downstream cell to selectively detect synchrony across those neurons (black arrows). Information about the value of the stimulus features encoded by the green and blue neurons is specifically transmitted at those times. However, at other moments differences in STP across the connections (the connection from the green neuron depresses more than the blue), combined with slight differences in spike timing, can lead to a switch in the subset of neurons whose partial synchrony can be detected: now, the subset includes either the green or the blue neuron together with others. For example, the white arrow indicates a time when the green, blue, and red neurons fire together but only the blue and red connections are strong enough to affect the activation of the downstream cell. At this time, it is the value of the features encoded by the blue and red neurons that is transmitted.

Similar articles

Cited by

References

    1. Abbott LF, Regehr WG. Synaptic computation. Nature. 2004;431:796–803. doi: 10.1038/nature03010. - DOI - PubMed
    1. Abbott LF, Varela JA, Sen K, Nelson SB. Synaptic depression and cortical gain control. Science. 1997;275:220–224. - PubMed
    1. Agmon A, Connors BW. Thalamocortical responses of mouse somatosensory (barrel) cortex in vitro. Neuroscience. 1991;41:365–379. doi: 10.1016/0306-4522(91)90333-J. - DOI - PubMed
    1. Arabzadeh E, Zorzin E, Diamond ME. Neuronal encoding of texture in the whisker sensory pathway. PLoS Biol. 2005;3:e17. doi: 10.1371/journal.pbio.0030017. - DOI - PMC - PubMed
    1. Bale MR, Ince RAA, Santagata G, Petersen RS. Population coding of texture-induced whisker motion in the ventroposterior medial nucleus of the thalamus. Soc Neurosci Abstr. 2011;37:704.14.

Publication types

LinkOut - more resources