. 2014 Jan 8;34(2):646-55.
doi: 10.1523/JNEUROSCI.3151-13.2014.

Neurons in dorsal anterior cingulate cortex signal postdecisional variables in a foraging task

Affiliations

Neurons in dorsal anterior cingulate cortex signal postdecisional variables in a foraging task

Tommy C Blanchard et al. J Neurosci. .

Abstract

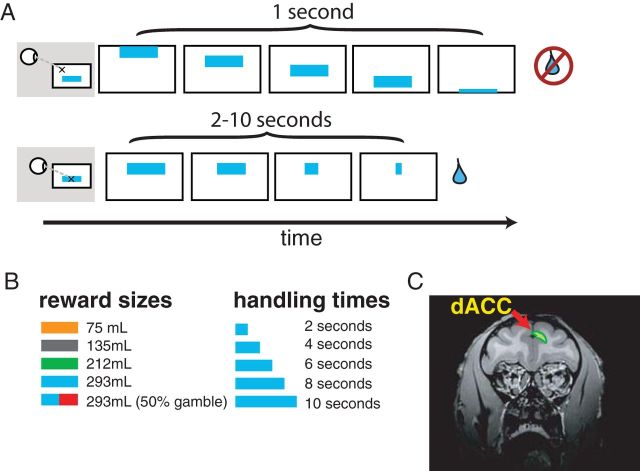
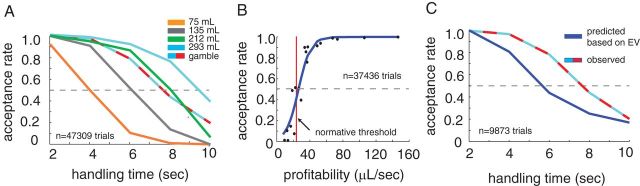
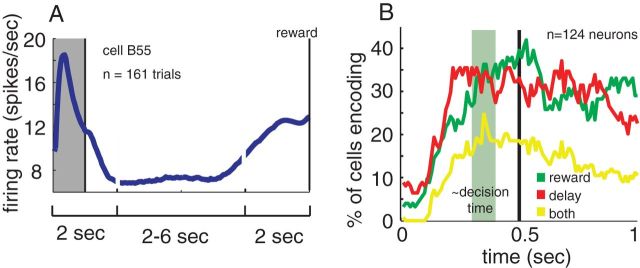
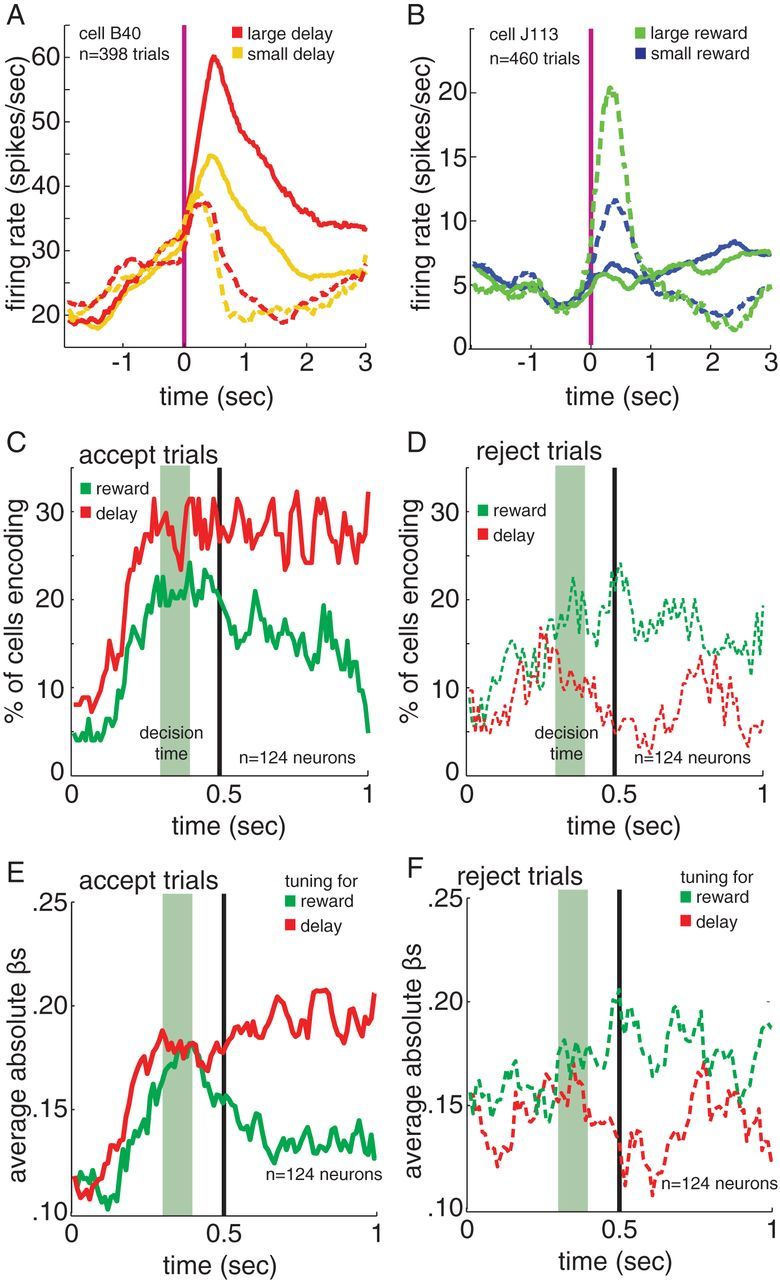
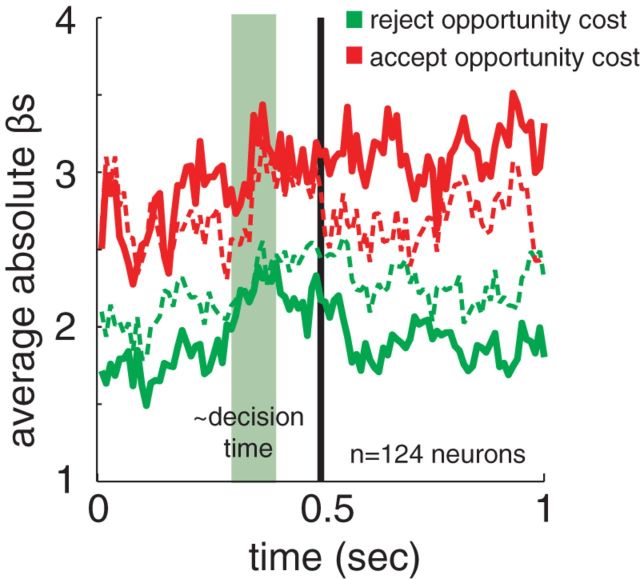
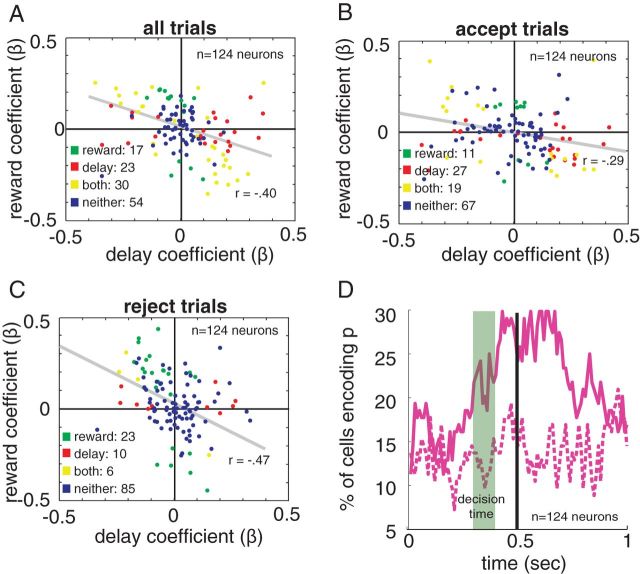
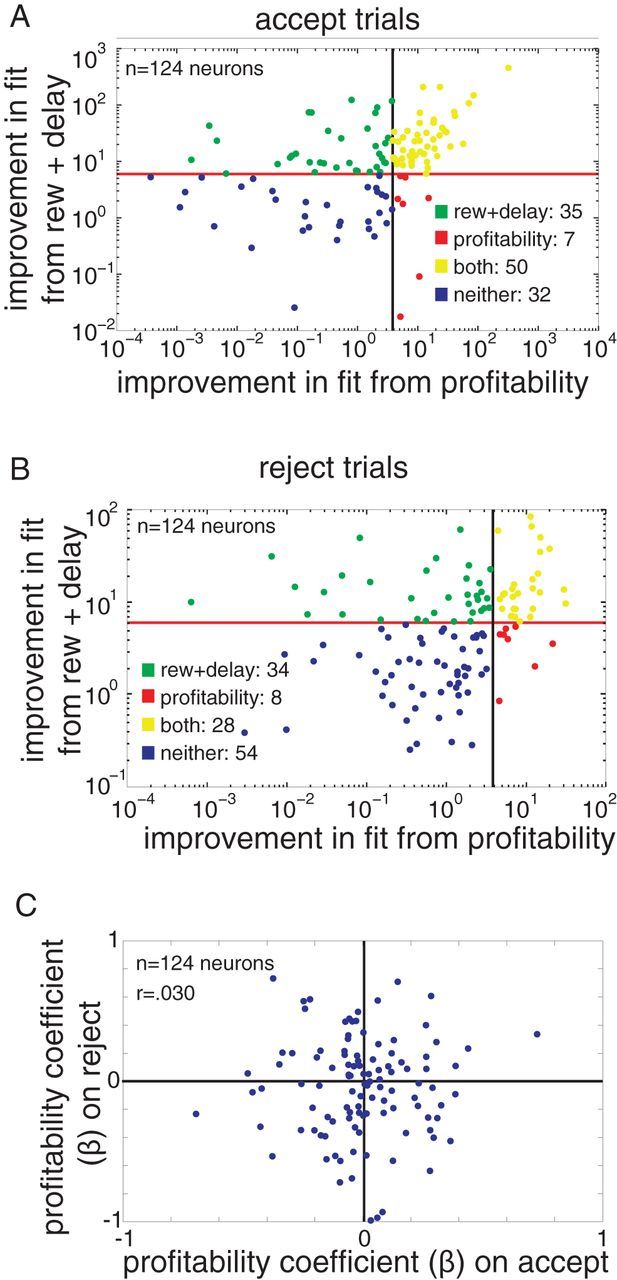
The dorsal anterior cingulate cortex (dACC) is a key hub of the brain's executive control system. Although a great deal is known about its role in outcome monitoring and behavioral adjustment, whether and how it contributes to the decision process remain unclear. Some theories suggest that dACC neurons track decision variables (e.g., option values) that feed into choice processes and is thus "predecisional." Other theories suggest that dACC activity patterns differ qualitatively depending on the choice that is made and is thus "postdecisional." To compare these hypotheses, we examined responses of 124 dACC neurons in a simple foraging task in which monkeys accepted or rejected offers of delayed rewards. In this task, options that vary in benefit (reward size) and cost (delay) appear for 1 s; accepting the option provides the cued reward after the cued delay. To get at dACC neurons' contributions to decisions, we focused on responses around the time of choice, several seconds before the reward and the end of the trial. We found that dACC neurons signal the foregone value of the rejected option, a postdecisional variable. Neurons also signal the profitability (that is, the relative value) of the offer, but even these signals are qualitatively different on accept and reject decisions, meaning that they are also postdecisional. These results suggest that dACC can be placed late in the decision process and also support models that give it a regulatory role in decision, rather than serving as a site of comparison.


Figures

Figure 1.
Figure 1.
Task and recording location. A, Task design. Options moved smoothly down the screen. Subjects fixated options to choose them. Rewards were given if fixation was maintained for a fixed delay (indicated by option width). Color indicated reward available. Two example trials are shown. In the first, the subject does not fixate (i.e., he rejects). In the second, the subject fixates to completion and receives a reward (i.e., he accepts). B, Reward sizes and handling times used. C, Recording site in dACC.
Figure 2.
Figure 2.
Behavior. A, Proportion of options accepted varied with both reward amount and delay. Colors indicate reward sizes as indicated by Figure 1B. B, Acceptance rate rose with profitability of option. Gamble options were excluded from this analysis. Blue line indicates best-fit logistic line. Red line is the optimal threshold (see Materials and Methods for optimality calculation details). C, Monkeys had a larger acceptance rate for gambles than would be expected based on the profitability of gambles. Blue line indicates the estimated acceptance rate for gamble options based on line fit from B. Blue-red dashed line indicates actual gamble acceptance rate. For all panels, error bars are smaller than the lines.
Figure 3.
Figure 3.
General neural response properties. A, The typical time course of the firing rate of an example neuron. An initial period of high activity follows the appearance of the option. Activity then stays steady for a fixed period, before ramping up in reward anticipation. The gray box indicates the first second, which is the focus this paper. The middle period is condensed for higher delay options, to show trials on the same scale. Only trials that are accepted and have delays of 6–10 s are included, to show the full time course leading up to reward. B, Percentage of cells that reach significant (p < 0.05) correlation between firing rate and delay (red), reward (green), and both (yellow) significant correlation for both delay and reward. Sliding boxcar analysis; window size is 100 ms, time 0 is the time of option appearance, and the green area indicates our best estimate of when the decision it being made.
Figure 4.
Figure 4.
On accept trials neurons are biased toward encoding delay, on reject trials neurons are biased toward encoding reward size. A, B, Average trial onset-aligned firing rates from example neurons. Solid lines indicate accept trials, dashed indicate reject trials. Example cells show, A, sensitivity to delay size during accept trials but not reject trials, and B, sensitivity to reward size on reject trials but not accept trials. Vertical red line indicates option onset. C, D, The percentage of neurons encoding reward (green) and delay (red) on C, accept trials and D, reject trials. In all cases, time 0 indicates time of option onset. E, F, The average strength of the regression coefficients for reward and delay, separated by E, accept trials and F, reject trials. In all cases, a plotted dashed line refers to reject trials and solid refers to accept trials. Sliding boxcar analysis: window size is 100 ms, time 0 is the time of option appearance, and the green area indicates our best estimate of when the decision it being made. Green area indicates estimated decision time. Vertical black line indicates 0.5 s, the beginning of the 500–1000 ms epoch analyzed and detailed in the text.
Figure 5.
Figure 5.
A plot of the regression coefficients from the boxcar analysis of reject and accept opportunity costs. Dashed lines indicate reject trial coefficients, solid indicate accept trial coefficients. Sliding boxcar analysis; window size is 100 ms, time 0 is the time of option appearance, and the green area indicates our best estimate of when the decision it being made.
Figure 6.
Figure 6.
Neurons encode profitability. A–C, Delay regression coefficients for each neuron plotted against that neuron's reward-size regression coefficient. The encoding of reward and delay are negatively correlated. Each point indicates an individual neuron's response to delay and reward; a negative coefficient means lower firing rate for higher values of the given variable. Points are color coded to indicate whether they reach significance (p < 0.05) for encoding of reward (green), delay (red), both (yellow), or neither (blue). Gray line indicates best-fit line. Showing data for A, all trials, B, accept trials, and C, reject trials. D, Percentage of neurons that have a significantly better fit with profitability added to the regression model than without.
Figure 7.
Figure 7.
Profitability overlaps with reward size and delay encoding, and encoding is different on accept versus reject trials. A, B, The improvement in fit (as measured by difference in deviance) from adding profitability to a model including reward size and delay, plotted against the improvement of fit in adding reward size and delay to a model including only profitability, for A, accept trials, and B, reject trials. Lines indicate value required to reach significance. Points are color coded to indicate whether they reach significance (p < 0.05) for significant improvement in fit from adding reward size and delay (green), profitability (red), both (yellow), or neither (blue). C, The regression coefficient for each neuron on accept trials plotted against its regression coefficient on reject trials. There is no significant correlation.

Similar articles

Cited by

References

    1. Alexander WH, Brown JW. Medial prefrontal cortex as an action-outcome predictor. Nat Neurosci. 2011;14:1338–1344. doi: 10.1038/nn.2921. - DOI - PMC - PubMed
    1. Amiez C, Joseph JP, Procyk E. Anterior cingulate error-related activity is modulated by predicted reward. Eur J Neurosci. 2005;21:3447–3452. doi: 10.1111/j.1460-9568.2005.04170.x. - DOI - PMC - PubMed
    1. Amiez C, Joseph JP, Procyk E. Reward encoding in the monkey anterior cingulate cortex. Cereb Cortex. 2006;16:1040–1055. doi: 10.1093/cercor/bhj046. - DOI - PMC - PubMed
    1. Bernacchia A, Seo H, Lee D, Wang XJ. A reservoir of time constants for memory traces in cortical neurons. Nat Neurosci. 2011;14:366–372. doi: 10.1038/nn.2752. - DOI - PMC - PubMed
    1. Boorman ED, Behrens TE, Rushworth MF. Counterfactual choice and learning in a neural network centered on human lateral frontopolar cortex. PLoS Biol. 2011;9:e1001093. doi: 10.1371/journal.pbio.1001093. - DOI - PMC - PubMed

Publication types

LinkOut - more resources