Comparative Study
. 2014 Jan 8;34(2):662-74.
doi: 10.1523/JNEUROSCI.0552-13.2014.

Comparison of sleep spindles and theta oscillations in the hippocampus

Affiliations
Comparative Study

Comparison of sleep spindles and theta oscillations in the hippocampus

David Sullivan et al. J Neurosci. .

Abstract

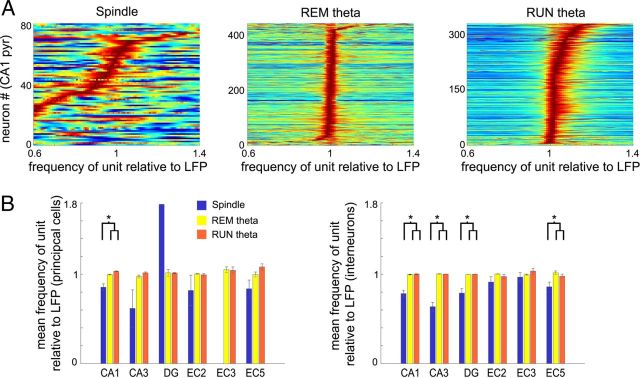
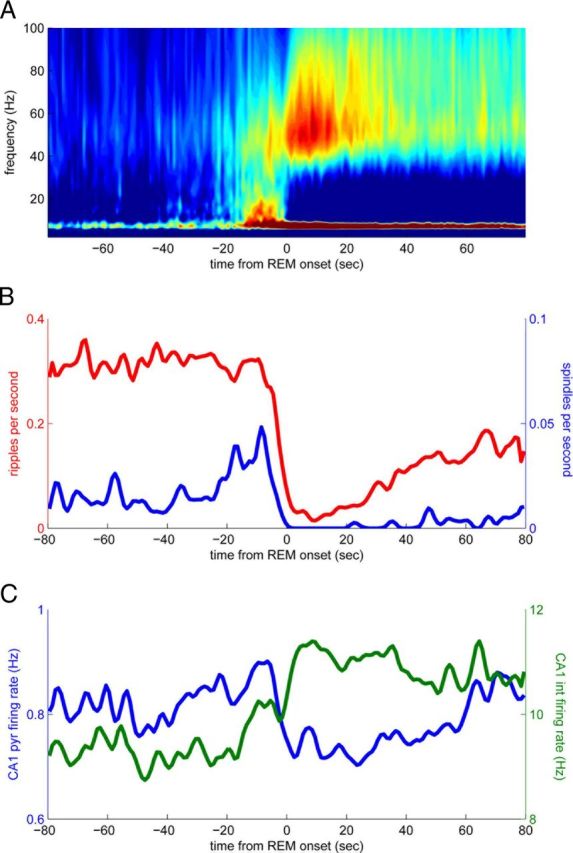
Several network patterns allow for information exchange between the neocortex and the entorhinal-hippocampal complex, including theta oscillations and sleep spindles. How neurons are organized in these respective patterns is not well understood. We examined the cellular-synaptic generation of sleep spindles and theta oscillations in the waking rat and during rapid eye movement (REM) sleep by simultaneously recording local field and spikes in the regions and layers of the hippocampus and entorhinal cortex (EC). We show the following: (1) current source density analysis reveals that similar anatomical substrates underlie spindles and theta in the hippocampus, although the hippocampal subregions are more synchronized during spindles than theta; (2) the spiking of putative principal cells and interneurons in the CA1, CA3, and dentate gyrus subregions of the hippocampus, as well as layers 2, 3, and 5 of medial EC, are significantly phase locked to spindles detected in CA1; (3) the relationship between local field potential (LFP) phase and unit spiking differs between spindles and theta; (4) individual hippocampal principal cells generally do not fire in a rhythmic manner during spindles; (5) power in gamma (30-90 Hz) and epsilon (>90 Hz) bands of hippocampal LFP is modulated by the phase of spindle oscillations; and (6) unit firing rates during spindles were not significantly affected by whether spindles occurred during non-REM or transitions between non-REM and REM sleep. Thus, despite the similar current generator inputs and macroscopic appearance of the LFP, the organization of neuronal firing patterns during spindles bears little resemblance to that of theta oscillations.

Keywords: entorhinal cortex; gamma; hippocampus; sleep; spindle; theta.


Figures

Figure 1.
Figure 1.
Basic features of sleep spindles. A, Example of filtered (1–626 Hz) LFP traces of a spindle event recorded simultaneously in the hippocampal CA1 pyramidal layer and visual cortex (vis. ctx). B, Example of filtered (1–625 Hz) LFP traces of a spindle event recorded simultaneously in the hippocampal CA1 pyramidal layer and layer 3 of medial EC. Note the similar onset, offset, and duration of the spindles in different structures. C, Histogram of mean instantaneous peak frequency of spindles recorded and detected in the hippocampal CA1 pyramidal layer (mean of 12.33 Hz, n = 2579 spindles in 15 rats). D, Histogram of spindle duration (mean of 0.49 s). E, Average coherence spectrum between spindles in the CA1 pyramidal layer and layer 5 of the EC (n = 8 sessions in 2 rats; error bars indicate SEM). Note the peak coherence value at 15 Hz. F, Cross-correlogram between LFP spindle minima and detected SWR events in hippocampal CA1 shows temporal association of these two patterns, peaking at 300 ms preceding individual spindle troughs in CA1, with SWR occurrence rate at 187% of baseline (n = 23 sessions in 14 rats).
Figure 2.
Figure 2.
Spindle and theta oscillations in the hippocampus. A, Example of wideband (1 Hz to 1250 Hz) LFP traces of a spindle event, recorded at multiple depths of the CA1–dentate axis and superimposed on the CSD map of the same event. CA1 pyr, Pyramidal layer; CA1 rad, stratum radiatum; CA1 l-m, stratum lacunosum-moleculare; DG mol, dentate gyrus molecular layer; DG gran, granule cell layer; CA3 pyr, pyramidal layer in the hilar region. B, Average CSD maps in a single animal with superimposed LFP traces during RUN, REM, and spindle. Recordings from two shanks of the silicon probe are shown. Maps and traces were constructed by averaging CSD and LFP traces according to CSD phase in CA1 stratum lacunosum-moleculare (phase was partitioned into 10°-wide bins). Asterisk indicates reference site. The cycles are calibrated in degrees rather than in time to emphasize the similar depth distributions of the sinks and sources during theta and spindle waves. The same CSD color scale was used in RUN, REM, and spindle plots; CSD units are relative and arbitrary because tissue impedance was not measured. C, Average normalized CSD as a function of phase in the three hippocampal principal cell layers (n = 5 sessions in 5 rats). Values >0 are sources, whereas values <0 are sinks. Note the enhanced synchrony of CSD in the CA1, CA3, and dentate principal cell layers during spindle oscillations relative to REM or RUN theta.
Figure 3.
Figure 3.
Firing rates are correlated across theta and spindle states. A, Correlations between firing rates during REM theta and spindle events (left) and RUN theta and spindle events (right) for both principal cells and interneurons. Note the log scale on both axes and that firing rates are higher during spindles. Each dot represents a single neuron. B, Mean firing rates during RUN, REM, and spindle events (with and without ripples excluded from spindle epochs) for all regions and both cell types. Significant differences are shown (p < 0.00001). C, Firing rate correlation coefficients between spindle and theta states in different regions. All correlations were significant (p < 0.05).
Figure 4.
Figure 4.
EC–hippocampal principal cells fire sporadically but strongly phase locked during spindles. A, Distribution of mean resultant lengths of phase modulation for CA1 pyramidal cells and interneurons during RUN and REM theta and spindle events. B, Group means of the mean resultant lengths of phase modulation in different regions. Note the stronger phase modulation of principal cells and weaker modulation of interneurons during spindles in many regions. Significant differences (p < 0.05) are indicated by *. C, Normalized autocorrelograms of CA1 pyramidal cells and interneurons. Note autorhythmicity during both RUN and REM and lack of rhythmic firing during spindle. D, Distribution of CCF of CA1 pyramidal cells and interneurons. Positive numbers indicate that the unit fires on consecutive cycles of the given rhythm more often than predicted by the firing rate of the unit alone. Note the primarily symmetric distribution during spindles for pyramidal cells and negative shift for interneurons attributable to cycle skipping higher than chance. E, Group means of the CCF in each region. Note the values close to 0 for principal cells and negative values for interneurons during spindles. Significant differences (p < 0.01) are indicated by *.
Figure 5.
Figure 5.
Firing phase preferences are different during theta and spindles. A, Correlations between phase preferences of CA1 pyramidal cells and interneurons between REM theta and spindle events (left) and RUN theta and spindle events (right). Each dot is a single neuron with significant phase locking to both theta and spindles. B, Distribution of phase preferences of significantly phase-modulated CA1 pyramidal cells (left) and interneurons (right). Black sinusoid represents CA1 pyramidal layer LFP. C, Phase distribution of spikes of all CA1 pyramidal cells (left) and interneurons (right). All neurons are included, independent of whether they were significantly phase locked to the LFP rhythm. D, Mean and SEM phase shift of the preferred firing phase between REM theta and spindle events and RUN theta and spindle events. All comparisons are significant (p < 0.0005) except for DG granule cells between spindle and RUN.
Figure 6.
Figure 6.
Phase interference of principal cells during theta and spindle oscillations. A, Spike phase spectra of neurons (Mizuseki et al., 2009; see Materials and Methods). Each color-coded row represents the power spectrum of a single CA1 pyramidal neuron, sorted by the magnitude of frequency shift of the power spectral peak. Power spectra were normalized by the amplitude of their peaks. Positive values indicate phase precession (O'Keefe and Recce, 1993). Note phase precession of many neurons during RUN and mainly phase retardation during spindle. B, Mean phase interference index (i.e., abscissa of A) for principal cells and interneurons in different regions. Significant differences (p < 0.05) are indicated by *. Only one DG principal cell had a valid spike phase spectrum during spindle events.
Figure 7.
Figure 7.
Cross-frequency phase–amplitude coupling during theta and spindle oscillations. A, Phase-modulated CSD wavelet maps during theta (RUN) and spindle activity at different depths. The color axis plots mean normalized power as a function of phase (determined from the deepest CA1 l-m channel) and frequency; power data from each channel is individually z-score normalized. Single-session CSD traces of simultaneously recorded sites (as in Fig. 2A) are superimposed on the wavelet maps. Of all hippocampal layers, gamma power is largest in the hilar region. B, Mean LFP wavelet maps from the CA1 pyramidal layer averaged over multiple animals (n = 23 sessions in 14 rats for REM and spindle; n = 17 sessions in 10 rats for RUN theta). Note the dominance of gamma power in the 50–90 Hz band during theta and its lack during spindle events. C, Group mean power spectra for RUN, REM, and spindle events. D, Theta and spindle phase modulation of spectral power (SD of power across phase as a function of frequency). CA1 pyr, Pyramidal layer; CA1 rad, stratum radiatum; CA1 l-m, stratum lacunosum-moleculare; DG mol, dentate gyrus molecular layer; DG gran, granule cell layer; CA3 pyr, pyramidal layer in the hilar region.
Figure 8.
Figure 8.
Spindles dominate intermediate sleep. A, Time-resolved wavelet power changes around non-REM–REM transition recorded from the CA1 pyramidal layers (n = 23 sessions in 13 rats). Note the increased spindle power before REM onset. Averaged ripple rates and detected spindle rates in the same sessions (B) and corresponding firing rate changes of pyramidal cells and interneurons (C). All REM transitions were used, even ones in which there was only a brief gap between REM episodes; occasionally, these inter-REM gaps were as short as 1 s.
Figure 9.
Figure 9.
Entrainment of EC–hippocampal circuits by sleep spindles during non-REM and intermediate sleep. A, Distribution of the mean resultant lengths (phase modulation) of CA1 pyramidal cells and interneurons during spindles detected during intermediate sleep (IS spindles) and non-REM sleep (non-IS spindles). B, Average values (and SEM) or the mean resultant length during IS and non-IS spindles. *p < 0.05. C, Fraction of significantly modulated neurons during IS and non-IS spindles. D, Firing rates of neurons during IS and non-IS spindle events.

Similar articles

Cited by

References

    1. Alonso A, Llinás RR. Subthreshold Na+-dependent rhythmicity in stellate cells of entorhinal cortex layer II. Nature. 1989;342:175–177. doi: 10.1038/342175a0. - DOI - PubMed
    1. Astori S, Wimmer RD, Prosser HM, Corti C, Corsi M, Liaudet N, Volterra A, Franken P, Adelman JP, Lüthi A. The ca(V)3.3 calcium channel is the major sleep spindle pacemaker in the thalamus. Proc Natl Acad Sci U S A. 2011;108:13823–13828. doi: 10.1073/pnas.1105115108. - DOI - PMC - PubMed
    1. Ayoub A, Mölle M, Preissl H, Born J. Grouping of MEG gamma oscillations by EEG sleep spindles. Neuroimage. 2012;59:1491–1500. doi: 10.1016/j.neuroimage.2011.08.023. - DOI - PubMed
    1. Belluscio MA, Mizuseki K, Schmidt R, Kempter R, Buzsáki G. Cross-frequency phase-phase coupling between θ and γ oscillations in the hippocampus. J Neurosci. 2012;32:423–435. doi: 10.1523/JNEUROSCI.4122-11.2012. - DOI - PMC - PubMed
    1. Bragin A, Jandó G, Nádasdy Z, Hetke J, Wise K, Buzsáki G. Gamma (40–100 Hz) oscillation in the hippocampus of the behaving rat. J Neurosci. 1995;15:47–60. - PMC - PubMed

Publication types

LinkOut - more resources