. 2014 Mar;25(5):712-27.
doi: 10.1091/mbc.E13-11-0634. Epub 2014 Jan 8.

A phosphatidylinositol transfer protein integrates phosphoinositide signaling with lipid droplet metabolism to regulate a developmental program of nutrient stress-induced membrane biogenesis

Affiliations

A phosphatidylinositol transfer protein integrates phosphoinositide signaling with lipid droplet metabolism to regulate a developmental program of nutrient stress-induced membrane biogenesis

Jihui Ren et al. Mol Biol Cell. 2014 Mar.

Abstract

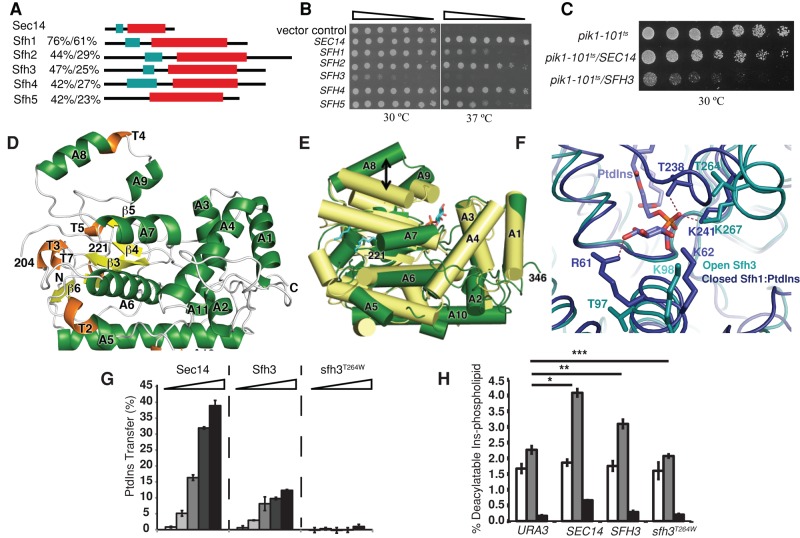
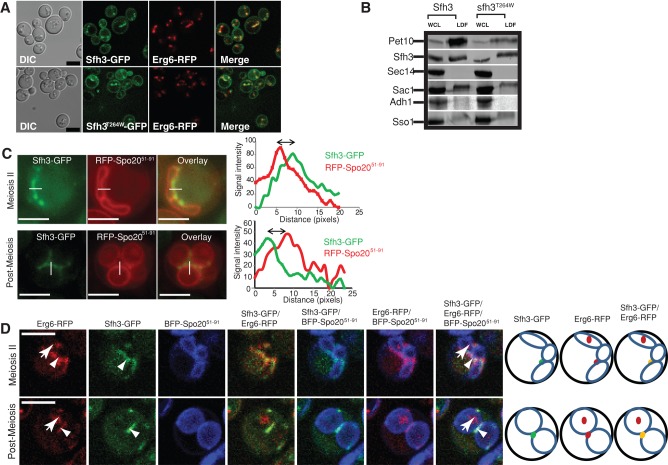
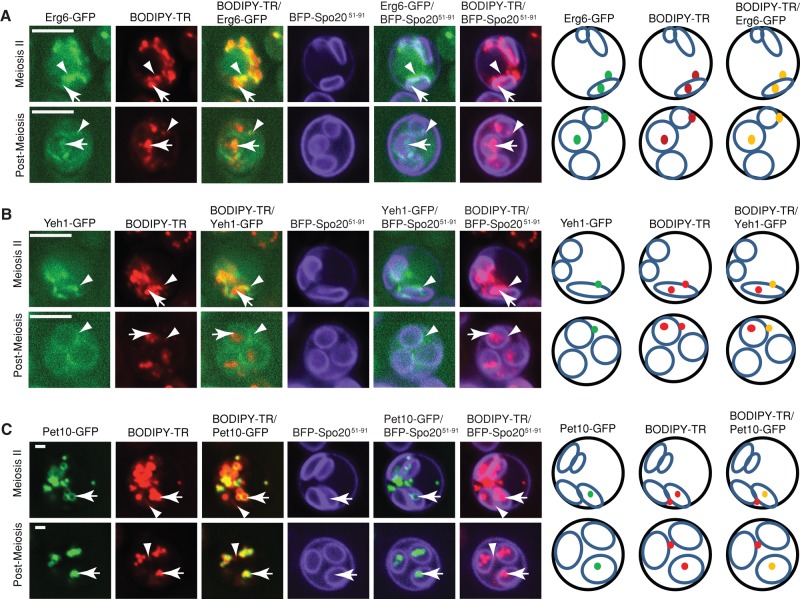
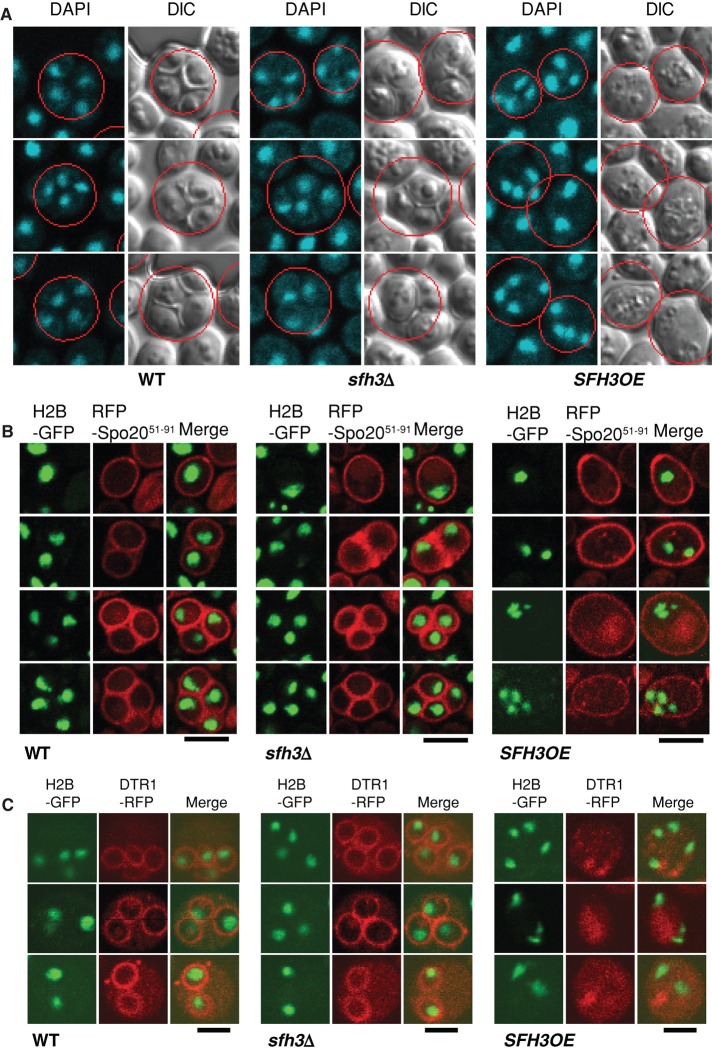
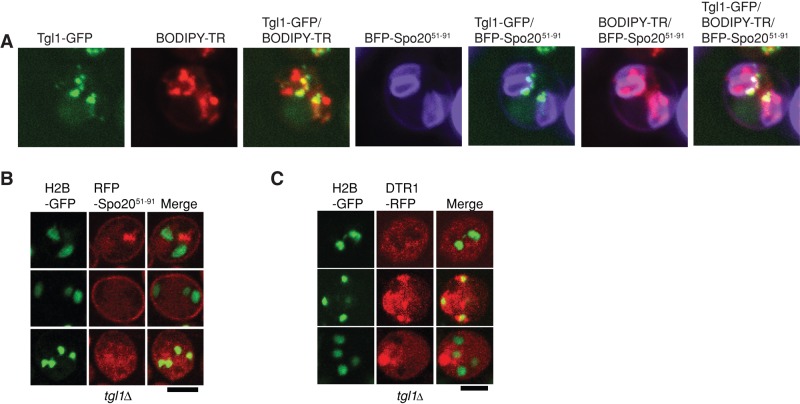
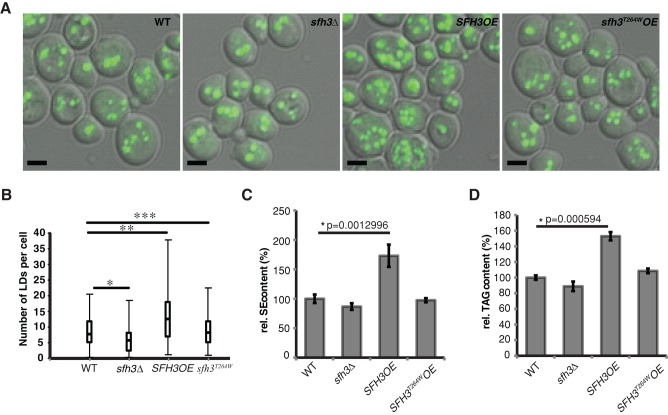
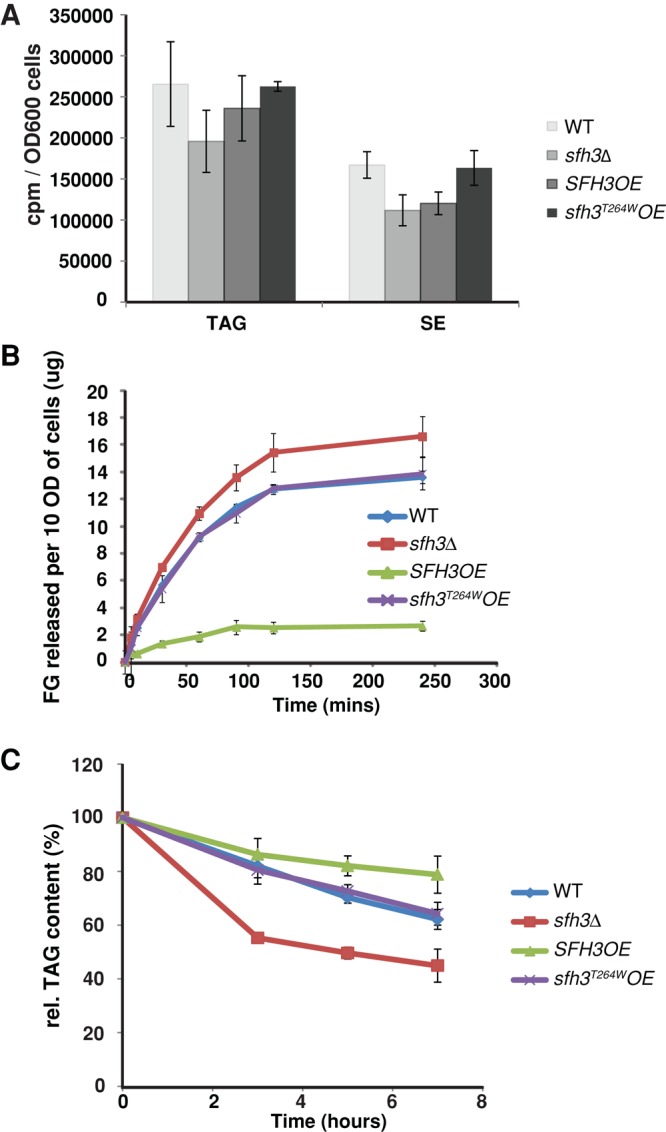
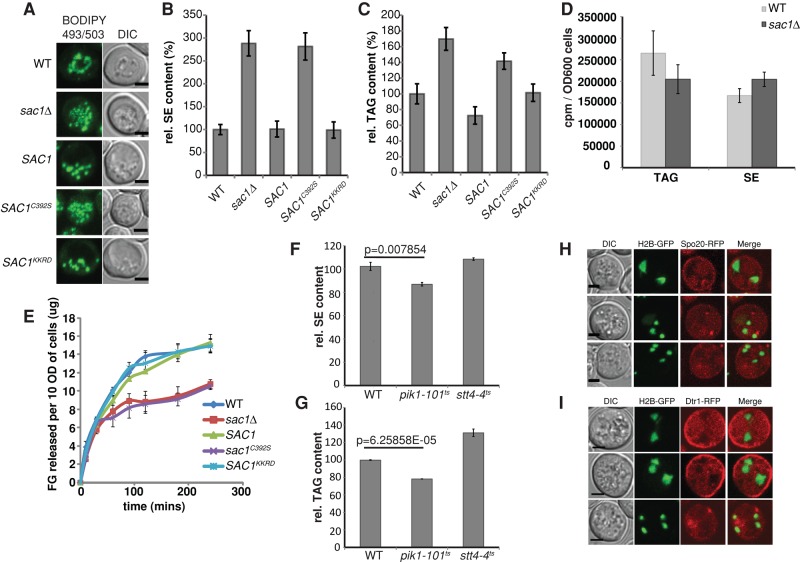
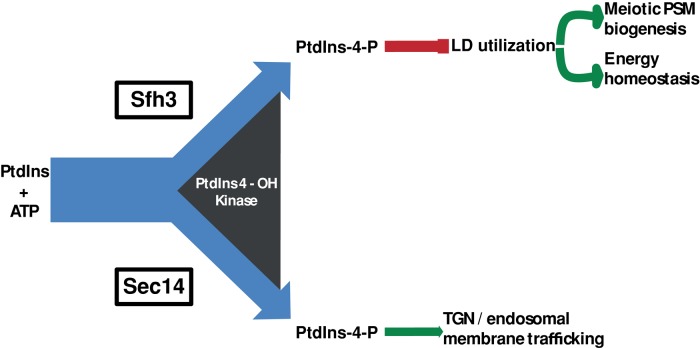
Lipid droplet (LD) utilization is an important cellular activity that regulates energy balance and release of lipid second messengers. Because fatty acids exhibit both beneficial and toxic properties, their release from LDs must be controlled. Here we demonstrate that yeast Sfh3, an unusual Sec14-like phosphatidylinositol transfer protein, is an LD-associated protein that inhibits lipid mobilization from these particles. We further document a complex biochemical diversification of LDs during sporulation in which Sfh3 and select other LD proteins redistribute into discrete LD subpopulations. The data show that Sfh3 modulates the efficiency with which a neutral lipid hydrolase-rich LD subclass is consumed during biogenesis of specialized membrane envelopes that package replicated haploid meiotic genomes. These results present novel insights into the interface between phosphoinositide signaling and developmental regulation of LD metabolism and unveil meiosis-specific aspects of Sfh3 (and phosphoinositide) biology that are invisible to contemporary haploid-centric cell biological, proteomic, and functional genomics approaches.


Figures

FIGURE 1:
FIGURE 1:
Sfh3 exhibits unique functional properties. (A) Domain organization of Sec14 and Sfh proteins. Primary sequence comparisons (similarity/identity) and domain organizations (N-terminal tripod domain, green box; lipid-binding domain, red box). (B) Sfh3 overexpression fails to rescue the growth of sec14-1ts mutant. Equivalent numbers of yeast sec14-1ts cells expressing the designated genes from episomal vectors were spotted in threefold dilution series onto SD agar and incubated at the permissive and restrictive temperatures of 30 and 37°C, respectively. Images were taken after 48-h incubations. (C) Sfh3 overexpression inhibits the growth of temperature sensitive pik1-101ts at permissive temperature of 30°C. Same amount of pik1-101ts cells containing indicated genes on multicopy plasmids were spotted in twofold dilution series on SD agar and incubated at 30°C for 48 h before images were taken. (D–F) Structural characterization of Sfh3. (D) Ribbon diagram of the Sfh3 crystal structure with α-helices in green, 310 helices in orange, and β-strands in yellow. (E) Superposition of Sfh3 (green) on Sfh1 (gold). Helices are shown as solid rods. Movement of gating helix A8 between open Sfh3 and closed Sfh1 conformers is designated by the arrow. (F) The PtdIns (magenta) binding pocket in Sfh1 (cyan) is superposed onto the corresponding residues in Sfh3 (green). Residues within 4.2 Å of the PtdIns headgroup are shown in stick representation. (G) Sfh3 phospholipid-transfer activities. Purified recombinant Sec14, Sfh3, and Sfh3T264W were assayed for PtdIns-transfer activity in a 0.004-, 0.2-, 1-, 5-, and 25-μg step series of protein. Average values and SD (n = 4). (H) Sfh3 potentiates PtdIns-4-P production in vivo. Strain CTY303 (sec14∆cki1∆) carrying the indicated genes on yeast episomal expression vectors was radiolabeled to steady state with [3H]inositol. Deacylated phosphoinositides were resolved and quantified (PtdIns-3-P, open bars; PtdIns-4-P, gray bars; PtdIns-4,5-P2, black bars). Average values and SD (n = 4). Data derived from PtdIns-4-P levels of URA3 plasmid control and SEC14, URA3 plasmid control, and SFH3, URA3 plasmid control and sfh3T264W were compared by t test: *p = 0.000797; **p = 0.009545; ***p = 0.300888.
FIGURE 2:
FIGURE 2:
Sfh3 is an LD-associated protein. (A) Yeast expressing Sfh3-GFP or sfh3T264W-GFP and Erg6-RFP from their endogenous promoters were cultured to logarithmic growth phase in minimum medium. Fluorescence images are shown along with their corresponding DIC images. Scale bar, 5 μm. (B) Purified LD fractions were prepared from sfh3Δ strains carrying SFH3 or sfh3T264W CEN expression plasmids, as indicated. Pet10, Sfh3, Sec14, Adh1, Sso1, and Sac1 were visualized by immunoblotting using specific polyclonal antibodies against each protein. Equal cell equivalents of whole-cell lysate (WCL) and purified LD fraction were loaded for each individual query protein blot. Purified LD fractions loads had ∼10 cell equivalents per 1 equivalent in the WCL fraction in each protein query blot. In all cases, Sec14 served as dual TGN protein and PITP control. Adh1 served as a cytosolic control. Sso1 and Sac1 served as plasma membrane and ER controls, respectively. (C, D) Sfh3 associates with a specific LD population during meiosis. (C) Diploid cells expressing Sfh3-GFP and the red fluorescence PSM marker RFP-Spo2051-91 were examined during and after completion of meiosis II. Right, line scans for both Sfh3-GFP and RFP-Spo2051-91 signal intensities across the PSM. Sfh3-GFP labeled LDs align exclusively along the ascal side of the expanding PSM, and the distance offset between Sfh3-GFP and RFP-Spo2051-91 peaks (indicated by the double-headed arrow) is 280 ± 61 nm. (D) Cells expressing Sfh3-GFP, Erg6-RFP, and the PSM marker mTagBFP-Spo2051-91 were examined during meiosis II (top) and after its completion (bottom). Also shown are overlays between the various signals. Arrowheads identify LDs labeled with both Sfh3-GFP and Erg6-RFP. Those LDs associate with the ascal side of PSM. Arrows identify LDs labeled with Erg6-RFP but not Sfh3-GFP. These droplets are inside the lumen of the PSM-limited compartment. Right, cartoon representations of signals identified by the arrows or arrowheads. Green dots represent Sfh3-GFP signal; red dots represent Erg6-RFP signals; yellow dots represent the colocalization between Sfh3-GFP and Erg6-RFP. PSMs are shown as blue oblongs (during meiosis II) and blue circles (completion of meiosis II).
FIGURE 3:
FIGURE 3:
LD heterogeneity during sporulation. (A) LDs were stained with BODIPY-TR. PSM was labeled with mTagBFP-Spo2051-91. LD proteins were tagged with GFP. Arrows highlight GFP protein localized within the PSM, and arrowheads highlight GFP protein associated with the ascal side of the PSM. Right, cartoon representations of signals identified by the arrows or arrowheads. Green dots represent GFP signal; red dots represent LDs stained with BODUPY-TR; yellow dots represent the merged signal. PSMs are shown as blue oblongs (during meiosis II) and blue circles (completion of meiosis II). (A) Erg6-GFP associates with all the LDs in sporulating yeast. (B) Yeh1-GFP–labeled LDs associate with the ascal side of PSM. (C) Pet10-GFP LDs distribute to the space enclosed by the PSM.
FIGURE 4:
FIGURE 4:
SFH3OE compromises PSM formation. (A) Diploid yeast (S288C) were transferred to starvation medium for 4 d and imaged. DNA was labeled with 4′,6-diamidino-2-phenylindole. Cells with four nuclei are identified by red circles. Cells that had produced mature spores were readily apparent by DIC microscopy for WT and sfh3∆ strains but not for the isogenic SFH3OE derivative. (B) WT, sfh3∆, and SFH3OE cells expressing RFP-Spo2051-91 were imaged. Yeast genomes were marked with histone H2B-GFP. For all strains, RFP-Spo2051-91 localized to the plasma membrane (PM) in vegetative cells (single nuclei). For sporulating WT and sfh3∆ cells (tetrads, triads, and dyads), RFP-Spo2051-91 labeled PSMs but remained targeted to the PMs of SFH3OE cells that had completed meiosis II (multiple nuclei). Bar, 5 μm. (C) WT, sfh3∆, and SFH3OE diploid cells expressing Dtr1-RFP were imaged after transfer to starvation medium for 12 h. Dtr1-RFP labeled PSMs of WT and sfh3∆ cells (tetrads, triads, and dyads) but remained cytosolic in SFH3OE cells that had completed Meiosis II (multiple nuclei). Bar, 5μm.
FIGURE 5:
FIGURE 5:
Defects in the LD-resident Tgl1 lipase compromise PSM formation. (A) Tgl1 is associated with LDs that line the ascal face of the PSM. LDs were stained with BODIPY-TR. PSM was labeled with mTagBFP-Spo2051-91. Tgl1 was tagged with GFP. (B, C) Homozygous tgl1∆ diploid cells are defective in PSM formation. Homozygous tgl1Δ diploids coexpressing H2B-GFP and either (A) RFP-Spo2051-91 or (B) Dtr1-RFP were imaged. Cells with multiple nuclei that failed to enclose the meiotic products with PSMs were a dominant phenotype for these cells.
FIGURE 6:
FIGURE 6:
LDs accumulate in SFH3OE cells. (A) Wild-type, sfh3Δ, SFH3OE, and sfh3T264W OE yeast were cultured in minimum medium to stationary phase before staining with BODYPY493/503. Representative images from each strain. Bar, 2 μm. (B) Whole-cell LD numbers were determined for ∼200 cells for each strain shown in A. Per-cell LD load distributions are shown as box plots composed of low, high, median, quartile I, and quartile III thresholds for cellular LD number in each group. Data from WT vs. sfh3Δ, WT vs. SFH3OE, and WT vs. sfh3T264WOE were compared by t test: *p = 6.92E-08; **p = 9.14E-07; ***p = 0.361, respectively. (C, D) Yeast of indicated genotypes were cultured in SD minimal medium with 2% glucose for 40 h. Whole-cell lipids were extracted and resolved by TLC. Total SE and TAG were quantified. SE (C) and TAG (D) contents of indicated yeast strains relative to WT. Values represent averages from three independent experiments plotted as mean average ± SD.
FIGURE 7:
FIGURE 7:
Sfh3 inhibits LD utilization. (A) Incorporation of [3H]oleate into neutral lipid synthesis in indicated strains. Logarithmic-growth-phase cells were pulsed with [3H]oleate, and incorporation of [3H]oleate into the indicated neutral lipid classes was quantified. Averages from three independent experiments. Error bars represent SDS. (B) Yeast of indicated genotype were cultured in SD minimal media for 40 h before transfer to starvation medium. Free glycerol release to the medium was measured at the indicated time points (10 OD600 = 1.5 × 10⁸ cells). (C) Yeast of indicated genotypes were cultured in SD minimal media for 40 h before transfer into fresh 2% glucose medium supplemented with 10 μg/ml cerulenin. Indicated lipids were quantified at the indicated time points.
FIGURE 8:
FIGURE 8:
Elevated PtdIns-4-P inhibits LD utilization. (A) Cells of indicated genotype were reconstituted for Sac1, sac1C392S, or Sac1KKRD expression (with appropriate CEN plasmid vectors, as indicated). LDs were stained with BODIPY493/503, and whole-cell projections of confocal Z-stacks are shown. (B, C) Yeast of indicated genotype were cultured in minimum medium with 2% glucose for 40 h. Whole-cell lipids were extracted and resolved by TLC. Total SE and TAG were quantified. Comparisons of the relative SE (B) and TAG (C) contents of the indicated yeast strains. The averages from three independent experiments are plotted as mean ± SD. (D) Incorporation of [3H]oleate into neutral lipid synthesis was measured in the indicated strains. WT and sac1Δ cells exhibited similar neutral lipid synthesis rates. (E) Cells of indicated genotype were cultured in minimal SD media before shift to starvation medium. Free glycerol release was measured at 0, 10, 30, 60, 90, 120, and 240 min after shift. (F, G) Pik1, but not Stt4, deficiencies result in decreased neutral lipid content. WT, pik1-101ts, and stt4-4ts strains were cultured in YPD to stationary phase. Each culture was then divided into two equal aliquots. One aliquot was cultured at 30ºC for another 3 h and the other was shifted to 37ºC for 3 h. Neutral lipids were extracted, resolved, and quantified. SE (F) and TAG (G) mass for indicated strains cultured at 37ºC relative to those cultured at 30ºC. (H, I) sac1Δ homozygous diploid cells are incompetent for PSM biogenesis. Diploid sac1Δ cells coexpressing H2B-GFP and (H) RFP-Spo2051-91 or (I) Dtr1-RFP and were imaged. Instead of enclosing the newly formed haploid genome, the indicated PSM markers stay on the PM or in cytosol.
FIGURE 9:
FIGURE 9:
Differential partitioning of PtdIns-4-P signaling outcomes by Sfh3 and Sec14. The PtdIns-4-P pools generated by action of a PtdIns 4-OH kinase (we presently favor Pik1) are channeled toward different biological outcomes. The pool generated by collaboration of Sec14 with the PtdIns 4-OH kinase channels to regulation of TGN/endosomal membrane trafficking, whereas the pool whose production is potentiated by Sfh3 is channeled toward control of LD utilization. We propose this to be a competitive design, as the fractional balance between Sfh3/kinase interactions and Sec14/kinase interactions will determine allocation of PtdIns-4-P signaling power toward specific cellular outcomes. This concept is on display in cells with reduced Sec14 or Pik1 and increased Sfh3 activities (Figure 1, B and C). A tunable PITP/lipid kinase balance affords considerable flexibility to the cellular PtdIns-4-P signaling landscape.

References

    1. Adamo JE, Moskow JJ, Gladfelter AS, Viterbo D, Lew DJ, Brennwald PJ. Yeast Cdc42 functions at a late step in exocytosis, specifically during polarized growth of the emerging bud. J Cell Biol. 2001;155:581–592. - PMC - PubMed
    1. Adeyo O, Horn PJ, Lee S, Binns DD, Chandrahas A, Chapman KD, Goodman JM. The yeast lipin orthologue Pah1p is important for biogenesis of lipid droplets. J Cell Biol. 2011;192:1043–1055. - PMC - PubMed
    1. Aitken JF, van Heusden GP, Temkin M, Dowhan W. The gene encoding the phosphatidylinositol transfer protein is essential for cell growth. J Biol Chem. 1990;265:4711–4717. - PubMed
    1. Altschul SF, Madden TL, Schaffer AA, Zhang J, Zhang Z, Miller W, Lipman DJ. Gapped BLAST and PSI-BLAST: a new generation of protein database search programs. Nucleic Acids Res. 1997;25:3389–3402. - PMC - PubMed
    1. Anderson JB, Sirjusingh C, Syed N, Lafayette S. Gene expression and evolution of antifungal drug resistance. Antimicrob Agents Chemother. 2009;53:1931–1936. - PMC - PubMed

Publication types

MeSH terms

Substances