

Separation of tumor cells with dielectrophoresis-based microfluidic chip
- PMID: 24403985
- PMCID: PMC3555970
- DOI: 10.1063/1.4774312
Separation of tumor cells with dielectrophoresis-based microfluidic chip
Abstract
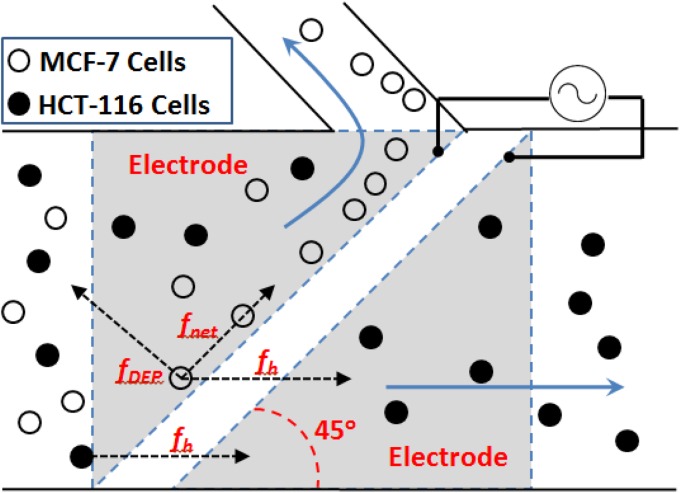
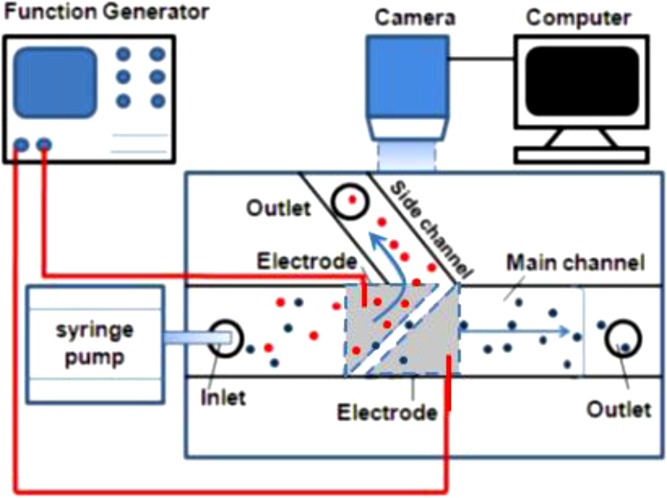
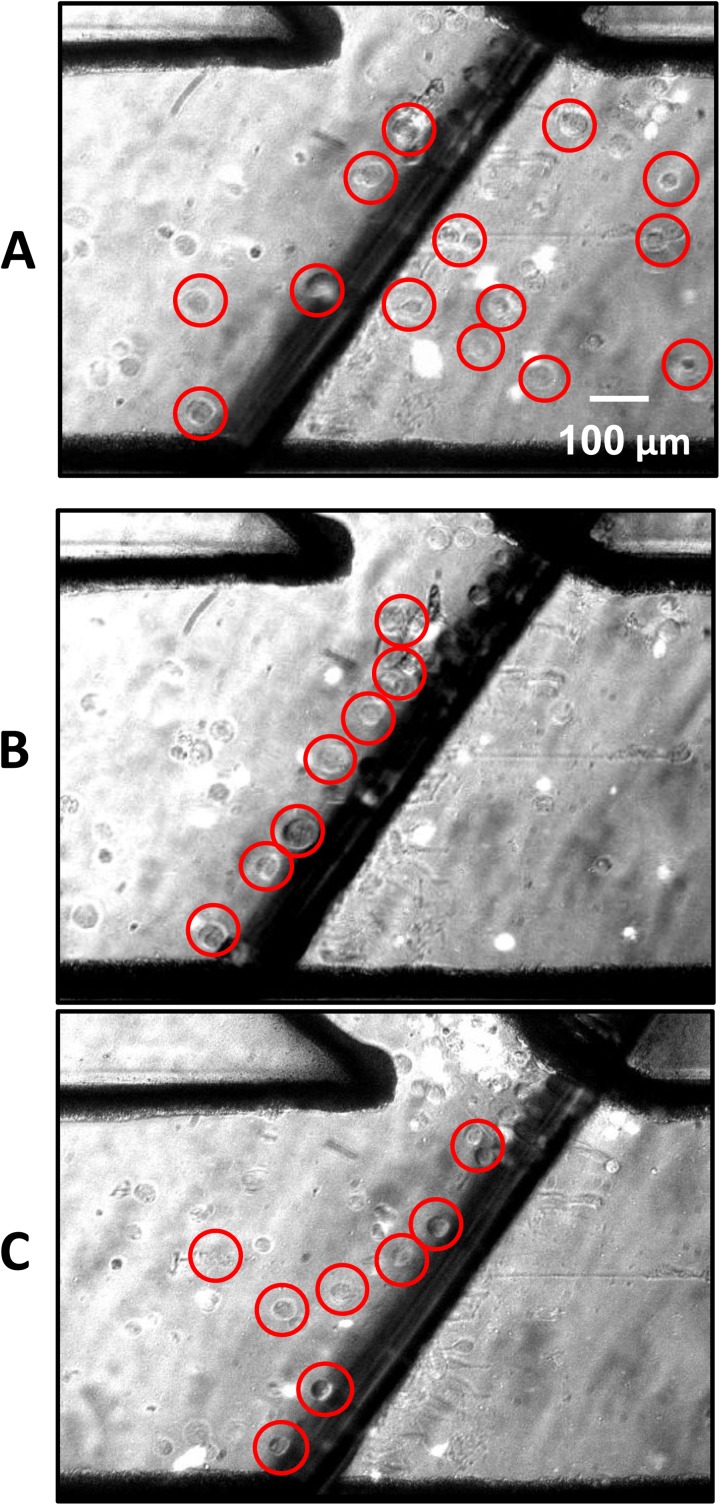
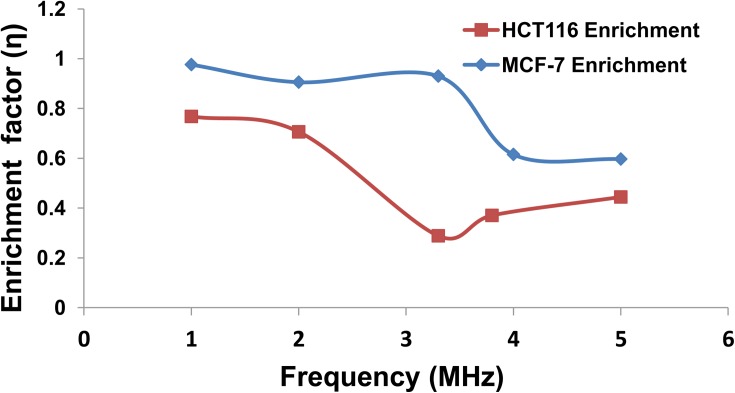
The present work demonstrates the use of a dielectrophoretic lab-on-a-chip device in effectively separating different cancer cells of epithelial origin for application in circulating tumor cell (CTC) identification. This study uses dielectrophoresis (DEP) to distinguish and separate MCF-7 human breast cancer cells from HCT-116 colorectal cancer cells. The DEP responses for each cell type were measured against AC electrical frequency changes in solutions of varying conductivities. Increasing the conductivity of the suspension directly correlated with an increasing frequency value for the first cross-over (no DEP force) point in the DEP spectra. Differences in the cross-over frequency for each cell type were leveraged to determine a frequency at which the two types of cell could be separated through DEP forces. Under a particular medium conductivity, different types of cells could have different DEP behaviors in a very narrow AC frequency band, demonstrating a high specificity of DEP. Using a microfluidic DEP sorter with optically transparent electrodes, MCF-7 and HCT-116 cells were successfully separated from each other under a 3.2 MHz frequency in a 0.1X PBS solution. Further experiments were conducted to characterize the separation efficiency (enrichment factor) by changing experimental parameters (AC frequency, voltage, and flow rate). This work has shown the high specificity of the described DEP cell sorter for distinguishing cells with similar characteristics for potential diagnostic applications through CTC enrichment.
Figures


Similar articles
-
Microfluidic device for the Separation of non-metastatic (MCF-7) and non-tumor (MCF-10A) breast cancer cells using AC Dielectrophoresis.J Vis Exp. 2022 Aug 11;(186). doi: 10.3791/63850. J Vis Exp. 2022. PMID: 36036617
-
AC-dielectrophoretic characterization and separation of submicron and micron particles using sidewall AgPDMS electrodes.Biomicrofluidics. 2012 Mar;6(1):12807-128079. doi: 10.1063/1.3682049. Epub 2012 Mar 15. Biomicrofluidics. 2012. PMID: 22662074 Free PMC article.
-
Continuous Cell Characterization and Separation by Microfluidic Alternating Current Dielectrophoresis.Anal Chem. 2019 May 7;91(9):6304-6314. doi: 10.1021/acs.analchem.9b01104. Epub 2019 Apr 22. Anal Chem. 2019. PMID: 30977369
-
Dielectrophoretic separation of blood cells.Biomed Microdevices. 2022 Aug 25;24(3):30. doi: 10.1007/s10544-022-00623-1. Biomed Microdevices. 2022. PMID: 36006519 Free PMC article. Review.
-
Electric field-induced effects on neuronal cell biology accompanying dielectrophoretic trapping.Adv Anat Embryol Cell Biol. 2003;173:III-IX, 1-77. doi: 10.1007/978-3-642-55469-8. Adv Anat Embryol Cell Biol. 2003. PMID: 12901336 Review.
Cited by
-
Recent advances in microfluidic methods in cancer liquid biopsy.Biomicrofluidics. 2019 Jul 23;13(4):041503. doi: 10.1063/1.5087690. eCollection 2019 Jul. Biomicrofluidics. 2019. PMID: 31431816 Free PMC article. Review.
-
Applications of Microfluidics and Organ-on-a-Chip in Cancer Research.Biosensors (Basel). 2022 Jun 27;12(7):459. doi: 10.3390/bios12070459. Biosensors (Basel). 2022. PMID: 35884262 Free PMC article. Review.
-
Isolation of circulating tumor cells in non-small-cell-lung-cancer patients using a multi-flow microfluidic channel.Microsyst Nanoeng. 2019 Feb 25;5:8. doi: 10.1038/s41378-019-0045-6. eCollection 2019. Microsyst Nanoeng. 2019. PMID: 31057935 Free PMC article.
-
Dielectric Characterization and Separation Optimization of Infiltrating Ductal Adenocarcinoma via Insulator-Dielectrophoresis.Micromachines (Basel). 2020 Mar 25;11(4):340. doi: 10.3390/mi11040340. Micromachines (Basel). 2020. PMID: 32218322 Free PMC article.
-
Enrichment and single-cell analysis of circulating tumor cells.Chem Sci. 2017 Mar 1;8(3):1736-1751. doi: 10.1039/c6sc04671a. Epub 2016 Dec 7. Chem Sci. 2017. PMID: 28451298 Free PMC article.
References
-
- Howlader N., Noone A. M., Krapcho M., Neyman N., Aminou R., Waldron W., Altekruse S. F., Kosary C. L., Ruhl J., Tatalovich Z., Cho H., Mariotto A., Eisner M. P., Lewis D. R., Chen H. S., Feuer E. J., Cronin K. A., and Edwards B. K., editors, SEER Cancer Statistics Review, 1975–2008, National Cancer Institute, Bethesda, MD, 2011.
-
- Muller V. and Pantel K., Am. J. Cancer 2, 77–86 (2003).10.2165/00024669-200302020-00001 - DOI
-
- Diel I., Kaufmann M., Goerner R., Costa S., Kaul S., and Bastert G., J. Clin. Oncol. 10, 1534–1539 (1992). - PubMed
Grants and funding
LinkOut - more resources
Full Text Sources
Other Literature Sources
Miscellaneous