

Empirical chemosensitivity testing in a spheroid model of ovarian cancer using a microfluidics-based multiplex platform
- PMID: 24403987
- PMCID: PMC3555942
- DOI: 10.1063/1.4774309
Empirical chemosensitivity testing in a spheroid model of ovarian cancer using a microfluidics-based multiplex platform
Abstract
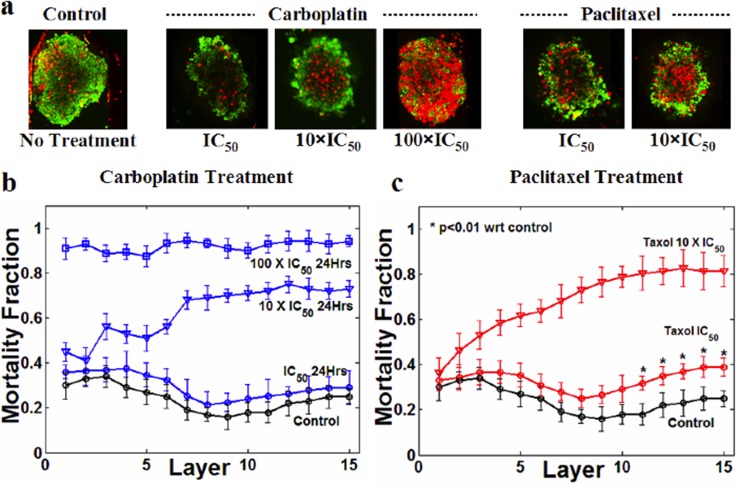
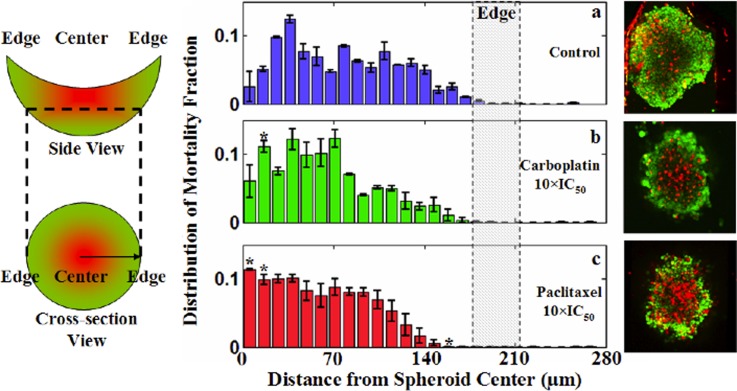
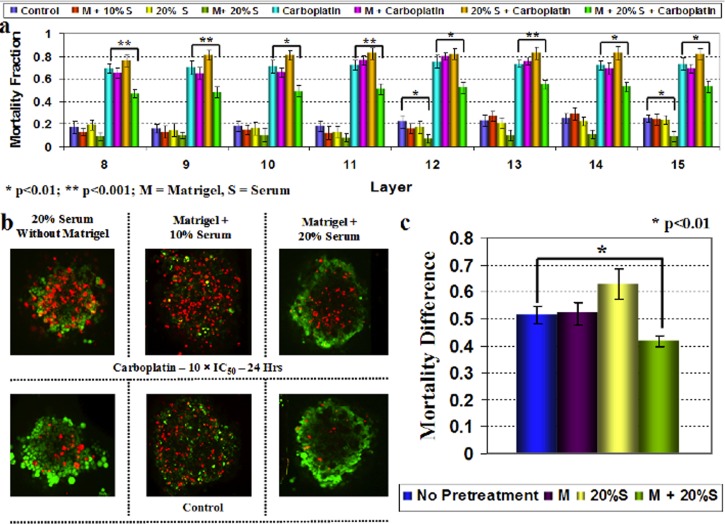
The use of biomarkers to infer drug response in patients is being actively pursued, yet significant challenges with this approach, including the complicated interconnection of pathways, have limited its application. Direct empirical testing of tumor sensitivity would arguably provide a more reliable predictive value, although it has garnered little attention largely due to the technical difficulties associated with this approach. We hypothesize that the application of recently developed microtechnologies, coupled to more complex 3-dimensional cell cultures, could provide a model to address some of these issues. As a proof of concept, we developed a microfluidic device where spheroids of the serous epithelial ovarian cancer cell line TOV112D are entrapped and assayed for their chemoresponse to carboplatin and paclitaxel, two therapeutic agents routinely used for the treatment of ovarian cancer. In order to index the chemoresponse, we analyzed the spatiotemporal evolution of the mortality fraction, as judged by vital dyes and confocal microscopy, within spheroids subjected to different drug concentrations and treatment durations inside the microfluidic device. To reflect microenvironment effects, we tested the effect of exogenous extracellular matrix and serum supplementation during spheroid formation on their chemotherapeutic response. Spheroids displayed augmented chemoresistance in comparison to monolayer culturing. This resistance was further increased by the simultaneous presence of both extracellular matrix and high serum concentration during spheroid formation. Following exposure to chemotherapeutics, cell death profiles were not uniform throughout the spheroid. The highest cell death fraction was found at the center of the spheroid and the lowest at the periphery. Collectively, the results demonstrate the validity of the approach, and provide the basis for further investigation of chemotherapeutic responses in ovarian cancer using microfluidics technology. In the future, such microdevices could provide the framework to assay drug sensitivity in a timeframe suitable for clinical decision making.
Figures
Similar articles
-
Cell subtype-dependent formation of breast tumor spheroids and their variable responses to chemotherapeutics within microfluidics-generated 3D microgels with tunable mechanics.Mater Sci Eng C Mater Biol Appl. 2020 Jul;112:110932. doi: 10.1016/j.msec.2020.110932. Epub 2020 Apr 6. Mater Sci Eng C Mater Biol Appl. 2020. PMID: 32409080
-
Hydrogel matrix presence and composition influence drug responses of encapsulated glioblastoma spheroids.Acta Biomater. 2021 Sep 15;132:437-447. doi: 10.1016/j.actbio.2021.05.005. Epub 2021 May 16. Acta Biomater. 2021. PMID: 34010694
-
Development of a 3D functional assay and identification of biomarkers, predictive for response of high-grade serous ovarian cancer (HGSOC) patients to poly-ADP ribose polymerase inhibitors (PARPis): targeted therapy.J Transl Med. 2020 Nov 19;18(1):439. doi: 10.1186/s12967-020-02613-4. J Transl Med. 2020. PMID: 33213473 Free PMC article.
-
The effects of size and shape of the ovarian cancer spheroids on the drug resistance and migration.Gynecol Oncol. 2020 Nov;159(2):563-572. doi: 10.1016/j.ygyno.2020.09.002. Epub 2020 Sep 18. Gynecol Oncol. 2020. PMID: 32958270
-
Multicellular tumor spheroids: an underestimated tool is catching up again.J Biotechnol. 2010 Jul 1;148(1):3-15. doi: 10.1016/j.jbiotec.2010.01.012. Epub 2010 Jan 25. J Biotechnol. 2010. PMID: 20097238 Review.
Cited by
-
Drug testing and flow cytometry analysis on a large number of uniform sized tumor spheroids using a microfluidic device.Sci Rep. 2016 Feb 15;6:21061. doi: 10.1038/srep21061. Sci Rep. 2016. PMID: 26877244 Free PMC article.
-
Electrical Impedance Spectroscopy for Microtissue Spheroid Analysis in Hanging-Drop Networks.ACS Sens. 2016 Jul 18;1(8):1028-1035. doi: 10.1021/acssensors.6b00272. ACS Sens. 2016. PMID: 33851029 Free PMC article.
-
Unlocking the Potential of Spheroids in Personalized Medicine: A Systematic Review of Seeding Methodologies.Int J Mol Sci. 2025 Jul 4;26(13):6478. doi: 10.3390/ijms26136478. Int J Mol Sci. 2025. PMID: 40650254 Free PMC article. Review.
-
A negative-pressure-driven microfluidic chip for the rapid detection of a bladder cancer biomarker in urine using bead-based enzyme-linked immunosorbent assay.Biomicrofluidics. 2013 Mar 7;7(2):24103. doi: 10.1063/1.4794974. eCollection 2013. Biomicrofluidics. 2013. PMID: 24404008 Free PMC article.
-
Microphysiologic systems in female reproductive biology.Exp Biol Med (Maywood). 2017 Nov;242(17):1690-1700. doi: 10.1177/1535370217697386. Epub 2017 Mar 8. Exp Biol Med (Maywood). 2017. PMID: 29065798 Free PMC article. Review.
References
LinkOut - more resources
Full Text Sources
Other Literature Sources
Research Materials