. 2013 Jan 10;7(1):11806.
doi: 10.1063/1.4774310. eCollection 2013.

Probing the mechanical properties of brain cancer cells using a microfluidic cell squeezer device

Affiliations

Probing the mechanical properties of brain cancer cells using a microfluidic cell squeezer device

Z S Khan et al. Biomicrofluidics. .

Abstract

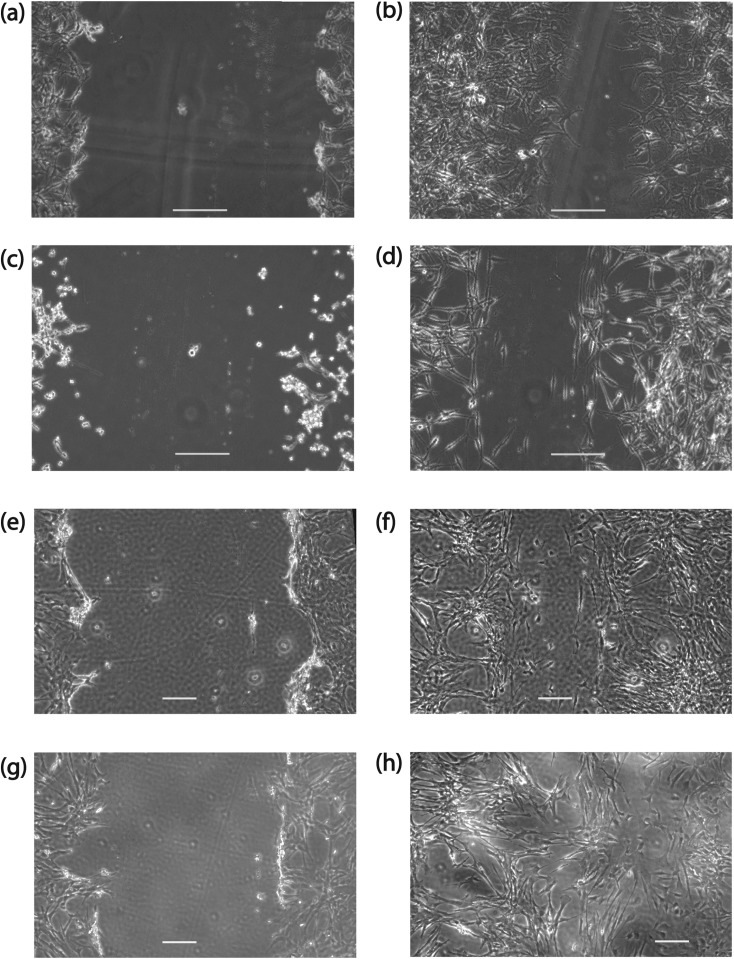
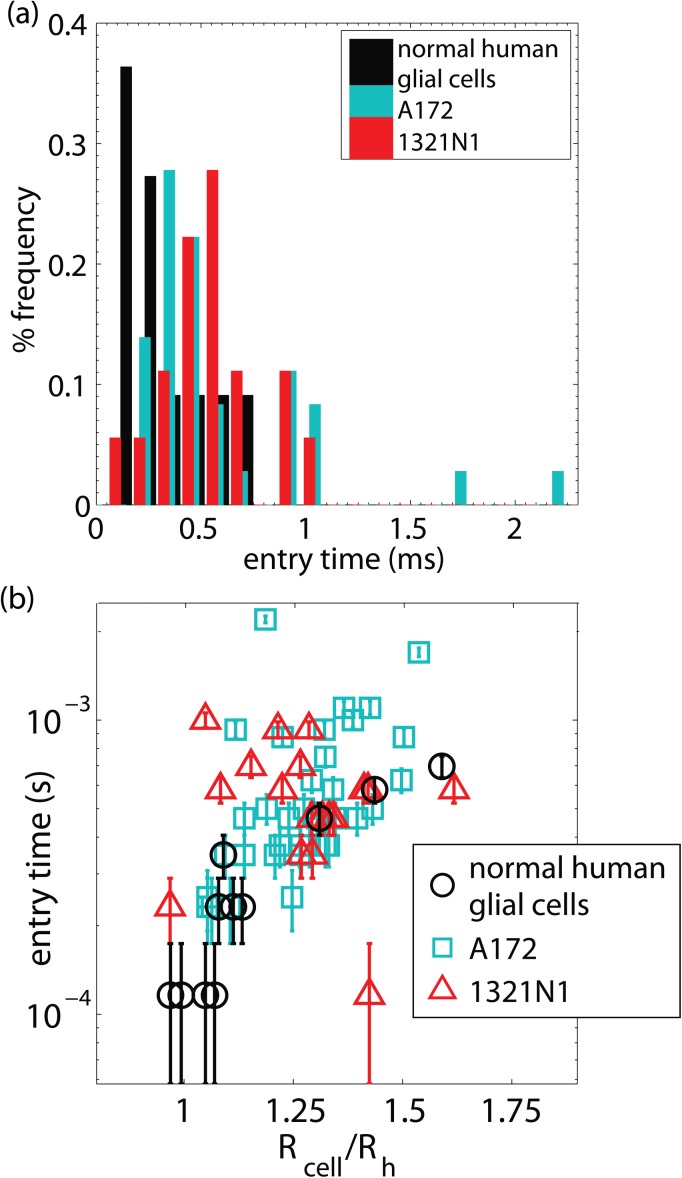
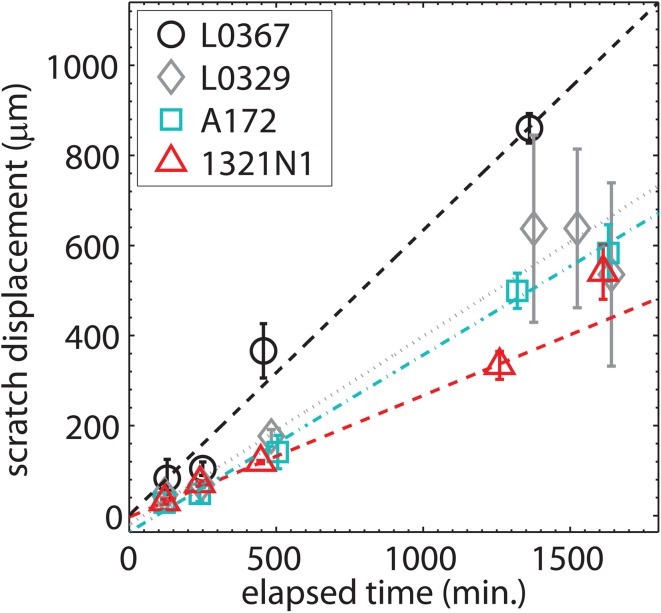
Despite being invasive within surrounding brain tissues and the central nervous system, little is known about the mechanical properties of brain tumor cells in comparison with benign cells. Here, we present the first measurements of the peak pressure drop due to the passage of benign and cancerous brain cells through confined microchannels in a "microfluidic cell squeezer" device, as well as the elongation, speed, and entry time of the cells in confined channels. We find that cancerous and benign brain cells cannot be differentiated based on speeds or elongation. We have found that the entry time into a narrow constriction is a more sensitive indicator of the differences between malignant and healthy glial cells than pressure drops. Importantly, we also find that brain tumor cells take a longer time to squeeze through a constriction and migrate more slowly than benign cells in two dimensional wound healing assays. Based on these observations, we arrive at the surprising conclusion that the prevailing notion of extraneural cancer cells being more mechanically compliant than benign cells may not apply to brain cancer cells.


Figures

Figure 1
Figure 1
Working principle of the microfluidic cell squeezer. (a) Image of the MCS with no cell present in the test channel's squeezer, resulting in a balanced interface in the comparator region between the fluids in the reference and test channels, when equal driving pressures (Pi) are imposed. (b) Image of the MCS with an A172 glioblastoma cell present in the test channel's squeezer, resulting in an interface displacement in the comparator region towards the channel with the higher hydrodynamic resistance or excess pressure drop.
Figure 2
Figure 2
Calibration of the microfluidic cell squeezer. Images of the MCS with a 4651 Pa driving pressure and an excess pressure of: (a) 76.06 Pa, and (b) 1250 Pa. (c) Plots of greyscale values 10 μm off the tip in the comparator region corresponding to figures (a) and (b) above, where the dashed curves correspond to sigmoid erf fits. (d) Calibration plot of interface displacement ΔY for known applied excess pressure drops ΔP. The solid line corresponds to a linear fit.
Figure 3
Figure 3
Wound scratch assay, where A172 cells are shown (a) at the time of scratch creation and (b) 1320 min after scratch creation. 1321N1 cells are shown (c) at the time the scratch was made and (d) 1300 min later. L0329 cells: (e) initial scratch and (f) 1376 min later. L0367 cells: (g) initial scratch and (h) 1407 min later. The length of the scale bars is 200 μm.
Figure 4
Figure 4
Left panel: excess pressure drop ΔP as a function of time for a single A172 cell passing through the MCS. Right panel: the A172 cell corresponding to the excess pressure drop in the left panel, shown in the squeezer at several times indicated in the left panel.
Figure 5
Figure 5
(a) Histogram of the peak pressure drop ΔPpeak, and (b) dependence of ΔPpeak on the cells' confinement as parametrized by the ratio of the cell's radius to the hydraulic radius of the squeezer.
Figure 6
Figure 6
(a) Histogram of the EI, and (b) dependence of EI on the cells' confinement.
Figure 7
Figure 7
(a) Histograms of the cell speed associated with the passage of a cell through a narrow microfluidic constriction, and (b) the dependence of cell speed on the cell's confinement.
Figure 8
Figure 8
(a) Histograms of the cells' entry times into the narrow constriction, and (b) the dependence of entry time on the cell's confinement.
Figure 9
Figure 9
Wound scratch displacement against time for normal healthy asctrocytes (L0367 and L0329 cell lines) and brain cancer cells (A172 glioblastoma and 1321N1 astrocytoma cell lines). The data points correspond to the mean over 3 runs, and the error bars correspond to the range of the data.

References

    1. Pilkington G. J., Brain Pathol. 4, 157 (1994). 10.1111/j.1750-3639.1994.tb00826.x - DOI - PubMed
    1. Darwish B., Koleda C., Lau H., Balakrishnan V., and Wickremesekera A., J. Clin. Neurosci. 11, 640 (2004). 10.1016/j.jocn.2003.12.008 - DOI - PubMed
    1. Schweitzer T., Vince G. H., Herbold C., Roosen K., and Tonn J. C., J. Neuro-Oncol. 53, 107 (2001). 10.1023/A:1012245115209 - DOI - PubMed
    1. Ulrich T. A., de Juan Pardo E. M., and Kumar S., Cancer Res. 69, 4167 (2009). 10.1158/0008-5472.CAN-08-4859 - DOI - PMC - PubMed
    1. Pathak A. and Kumar S., Integr. Biol. 3, 267 (2011). 10.1039/c0ib00095g - DOI - PubMed