

Computational modeling of 3D tumor growth and angiogenesis for chemotherapy evaluation
- PMID: 24404145
- PMCID: PMC3880288
- DOI: 10.1371/journal.pone.0083962
Computational modeling of 3D tumor growth and angiogenesis for chemotherapy evaluation
Abstract
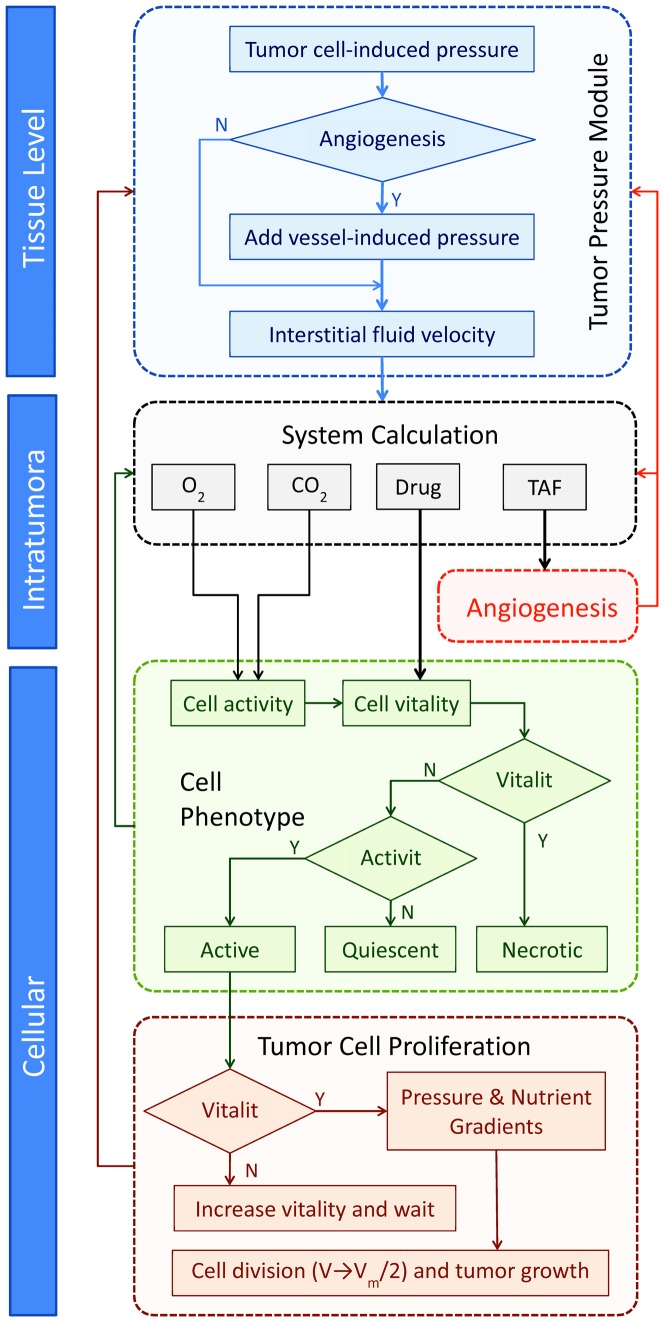
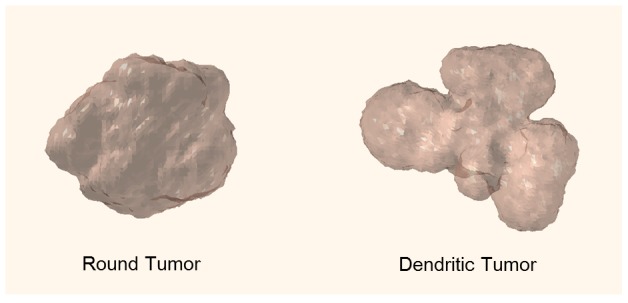
Solid tumors develop abnormally at spatial and temporal scales, giving rise to biophysical barriers that impact anti-tumor chemotherapy. This may increase the expenditure and time for conventional drug pharmacokinetic and pharmacodynamic studies. In order to facilitate drug discovery, we propose a mathematical model that couples three-dimensional tumor growth and angiogenesis to simulate tumor progression for chemotherapy evaluation. This application-oriented model incorporates complex dynamical processes including cell- and vascular-mediated interstitial pressure, mass transport, angiogenesis, cell proliferation, and vessel maturation to model tumor progression through multiple stages including tumor initiation, avascular growth, and transition from avascular to vascular growth. Compared to pure mechanistic models, the proposed empirical methods are not only easy to conduct but can provide realistic predictions and calculations. A series of computational simulations were conducted to demonstrate the advantages of the proposed comprehensive model. The computational simulation results suggest that solid tumor geometry is related to the interstitial pressure, such that tumors with high interstitial pressure are more likely to develop dendritic structures than those with low interstitial pressure.
Conflict of interest statement
Figures


References
-
- Endrich B, Reinhold H, Gross J, Intaglietta M (1979) Tissue perfusion inhomogeneity during early tumor growth in rats. J Natl Cancer Inst 62: 387–395. - PubMed
-
- Carmeliet P, Jain R (2011) Principles and mechanisms of vessel normalization for cancer and other angiogenic diseases. Nat Rev Drug Discov 10: 417–427. - PubMed
-
- Araujo R, McElwain D (2004) A history of the study of solid tumour growth: the contribution of mathematical modelling. Bull Math Biol 66: 1039–1091. - PubMed
Publication types
MeSH terms
Substances
Grants and funding
- 1U54CA143907/CA/NCI NIH HHS/United States
- U54 CA143907/CA/NCI NIH HHS/United States
- 1U54CA151668/CA/NCI NIH HHS/United States
- U54 CA151668/CA/NCI NIH HHS/United States
- U54 CA143837/CA/NCI NIH HHS/United States
- R01 EB009009/EB/NIBIB NIH HHS/United States
- U01CA166886-01/CA/NCI NIH HHS/United States
- U54 CA149196/CA/NCI NIH HHS/United States
- 5R01EB009009-06/EB/NIBIB NIH HHS/United States
- 1U54CA143837/CA/NCI NIH HHS/United States
- U01 CA166886/CA/NCI NIH HHS/United States
- 1U54CA149196/CA/NCI NIH HHS/United States
LinkOut - more resources
Full Text Sources
Other Literature Sources
