. 2014 Jan 3;9(1):e84513.
doi: 10.1371/journal.pone.0084513. eCollection 2014.

T cells detect intracellular DNA but fail to induce type I IFN responses: implications for restriction of HIV replication

Affiliations

T cells detect intracellular DNA but fail to induce type I IFN responses: implications for restriction of HIV replication

Randi K Berg et al. PLoS One. .

Abstract

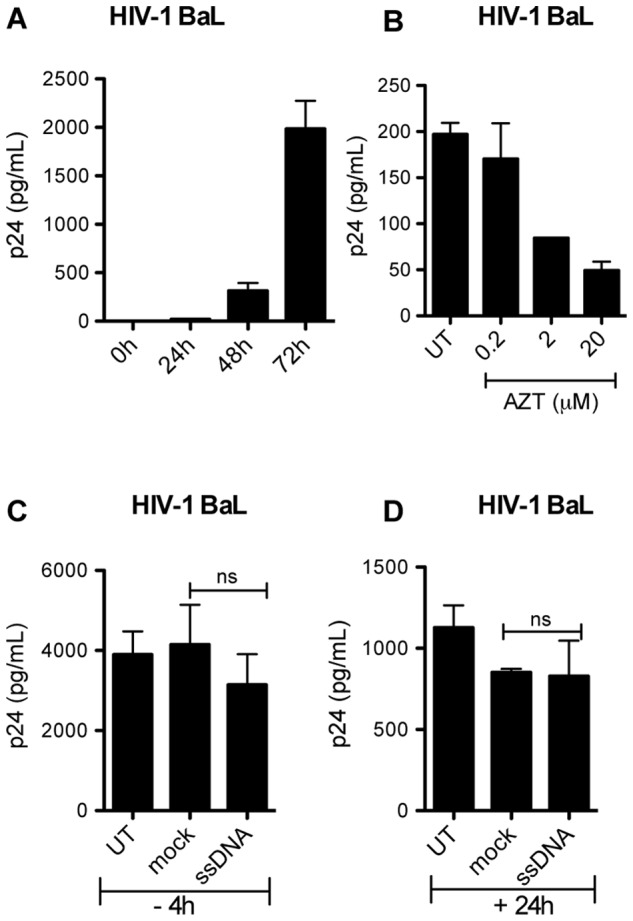
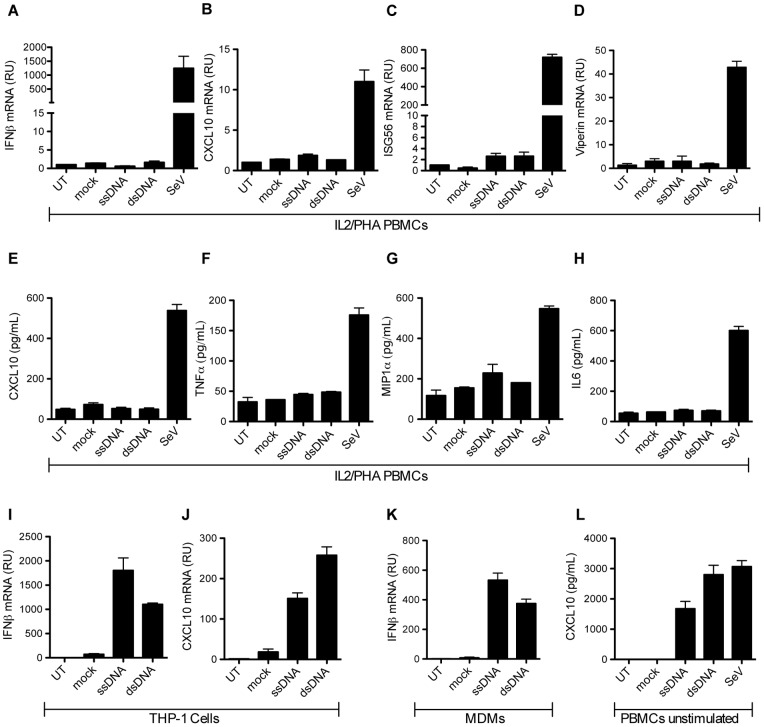
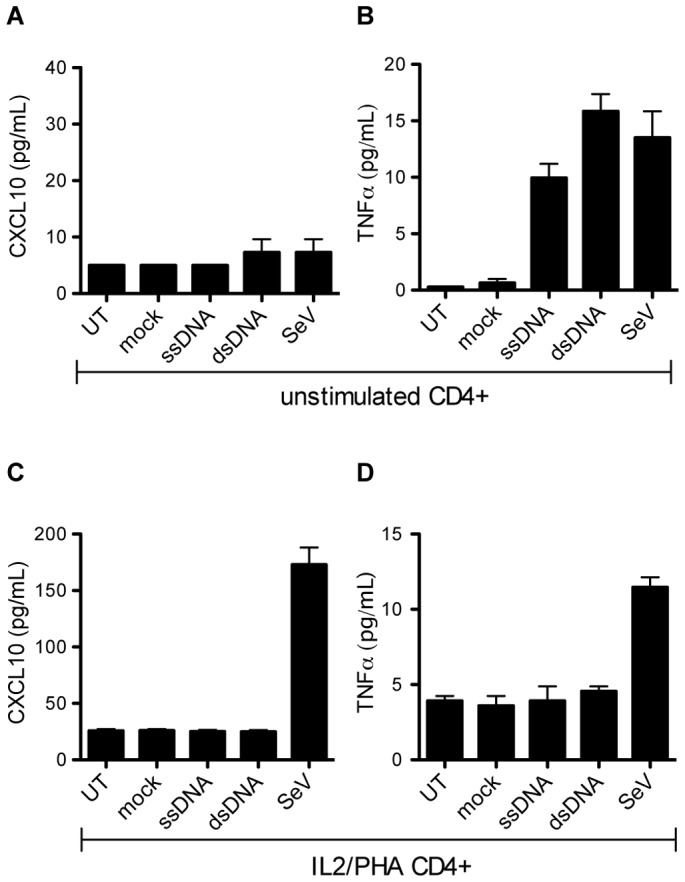
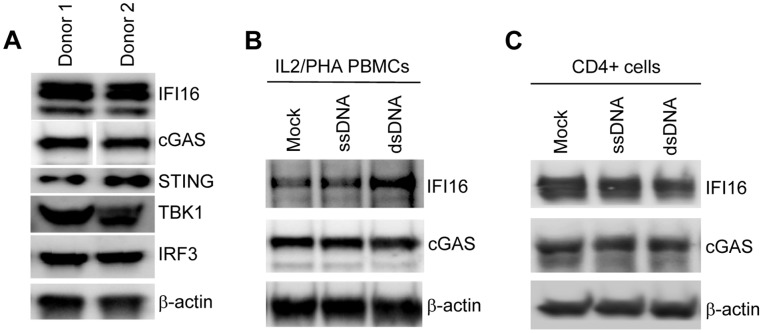
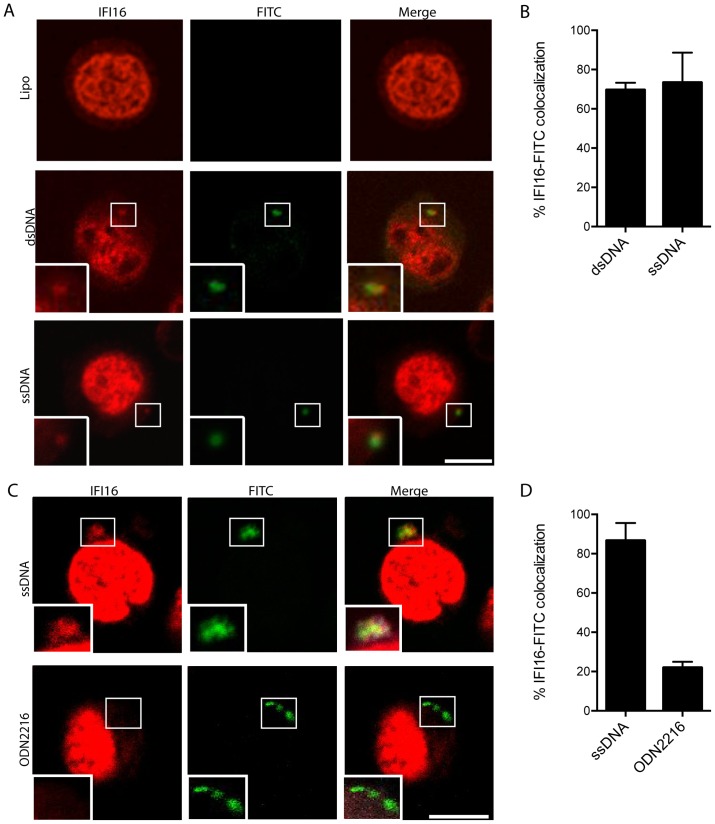
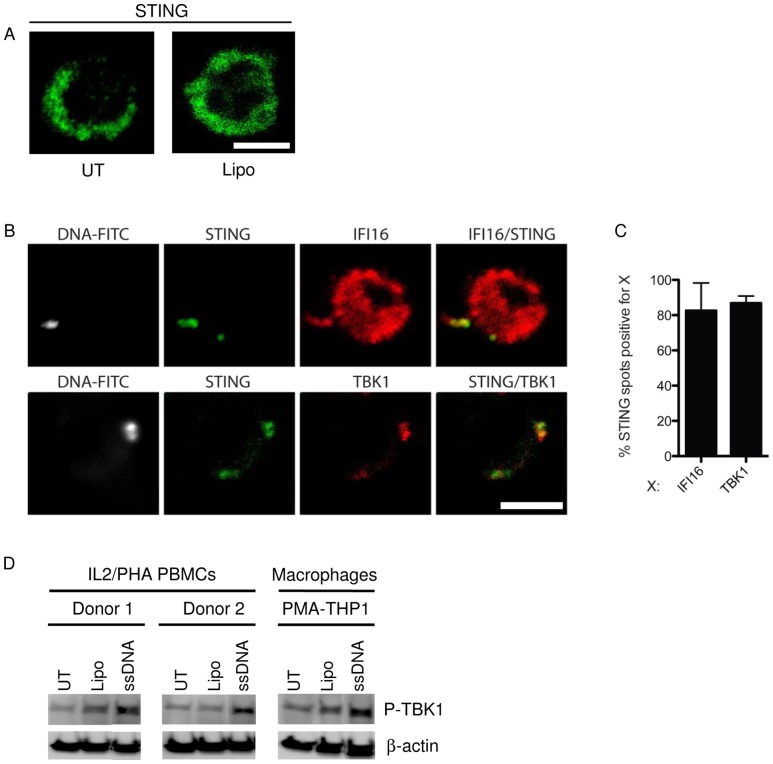
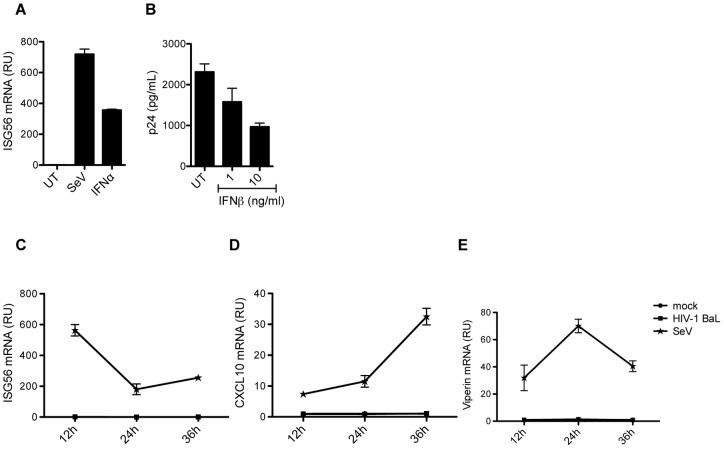
HIV infects key cell types of the immune system, most notably macrophages and CD4+ T cells. Whereas macrophages represent an important viral reservoir, activated CD4+ T cells are the most permissive cell types supporting high levels of viral replication. In recent years, it has been appreciated that the innate immune system plays an important role in controlling HIV replication, e.g. via interferon (IFN)-inducible restriction factors. Moreover, innate immune responses are involved in driving chronic immune activation and the pathogenesis of progressive immunodeficiency. Several pattern recognition receptors detecting HIV have been reported, including Toll-like receptor 7 and Retinoic-inducible gene-I, which detects viral RNA. Here we report that human primary T cells fail to induce strong IFN responses, despite the fact that this cell type does express key molecules involved in DNA signaling pathways. We demonstrate that the DNA sensor IFI16 migrates to sites of foreign DNA localization in the cytoplasm and recruits the signaling molecules stimulator of IFN genes and Tank-binding kinase, but this does not result in expression of IFN and IFN-stimulated genes. Importantly, we show that cytosolic DNA fails to affect HIV replication. However, exogenous treatment of activated T cells with type I IFN has the capacity to induce expression of IFN-stimulated genes and suppress HIV replication. Our data suggest the existence of an impaired DNA signaling machinery in T cells, which may prevent this cell type from activating cell-autonomous anti-HIV responses. This phenomenon could contribute to the high permissiveness of CD4+ T cells for HIV-1.


Conflict of interest statement

Competing Interests: The authors have declared that no competing interests exist.

Figures

Figure 1
Figure 1. Cytosolic DNA does not affect HIV-1 BaL replication in IL2/PHA PBMCs.
(A) IL2/PHA PBMCs were infected with HIV-1 BaL at an MOI of 0.002, and p24 levels were measured in the supernatants after 24, 48, and 72 hours of infection. (B) IL2/PHA PBMCs were pretreated with AZT at increasing doses 30 min before infection with HIV-1 BaL at an MOI of 0.002. Levels of p24 were measured in the supernatants 72 hours post infection by ELISA. (C, D) IL2/PHA PBMCs were transfected with ssDNA (2 µg/mL) (C) 4 hours before or (D) 24 hours after infection with HIV-1. Supernatants were harvested 72 hours post infection and p24 levels measured by ELISA. Data are shown as mean of triplicates +/− SD. Similar results were obtained in three or more independent experiments. Mock, Lipofectamine.
Figure 2
Figure 2. IL2/PHA PBMCs fail to induce type I IFN responses and pro-inflammatory cytokines upon DNA transfection.
(A–D) IL2/PHA PBMCs were transfected with HIV-derived ssDNA and dsDNA (2 µg/mL), or infected with SeV (MOI 0.5). Total RNA was isolated after 6 hours for RT-qPCR measurements of (A) IFNβ, (B) CXCL10, (C) ISG56, and (D) Viperin. (E–H) IL2/PHA PBMCs were transfected with ssDNA and dsDNA (2 µg/mL), or infected with SeV (MOI 0.5). Supernatants were harvested after 24 hours and analyzed for CXCL10, TNFα, MIP-1α, and IL6 protein levels. (I–J) PMA (100 nM) treated THP-1 cells were transfected with ssDNA and dsDNA (2 µg/mL). Total RNA was harvested after 6 hours for RT-qPCR measurements of IFNβ and CXCL10 mRNA. (K) Primary human monocyte-derived macrophages (MDM)s were transfected with ssDNA and dsDNA (2 µg/mL). Total RNA was harvested after 6 hours for RT-qPCR measurements of IFNβ. (L) Un-stimulated PBMCs were isolated and immediately transfected with ssDNA and dsDNA (2 µg/mL), or infected with SeV (MOI 0.5). Supernatants were harvested after 24 hours and analyzed for CXCL10 by ELISA. Both PCR and ELISA data are shown as means of triplicates +/− SD. Similar results were obtained in three independent experiments. Mock, Lipofectamine.
Figure 3
Figure 3. Comparison of un-stimulated and IL2/PHA stimulated CD4+ cells in response to DNA transfection.
CD4+ T cells were isolated and either left untreated or activated with IL2/PHA prior to further treatment. The cells were transfected with ssDNA and dsDNA (2 µg/mL), or infected with SeV (MOI 0.5). Supernatants were harvested 24 hours later and analyzed for levels of (A, C) CXCL10 and (B, D) TNFα. Data are shown as means of triplicates +/− SD. Similar results were obtained in two independent experiments. Mock, Lipofectamine.
Figure 4
Figure 4. Expression of DNA signaling pathway molecules in IL2/PHA PBMCs and CD4+ T cells.
(A) Whole cell lysates of IL2/PHA PBMCs from 2 donors were analyzed for expression of IFI16, STING, TBK1, IRF3 and β-actin by Western Blotting. (B, C) Whole cell lysates from IL2/PHA-treated PBMCs and CD4+ T cells were stimulated with ssDNA, dsDNA (both 2 µg/mL) or lipofactamine for 2 h of IL2/PHA PBMCs were analyzed for levels of IFI16 and cGAS by Western Blotting. Similar results were obtained with two independent donors.
Figure 5
Figure 5. Transfected DNA co-localizes with the DNA sensor IFI16 in activated T cells.
(A, C) IL2/PHA PBMCs transfected with 2 µg/mL of FITC-labeled DNA or 0.5 µM ODN2216 as indicated for 2 hours were fixed and stained with anti-IFI16 antibody and visualized by confocal microscopy. Presented cells stained positive for CD3. IFI16 is shown in red and DNA in green. (B, D) Percentage colocalization of cytoplasmic spots positive for IFI16 and DNA. Data is based on quantification of IFI16/DNA spots in more than 100 cells per donor in 3 different donors. Data is shown as means +/− SD. Scale bar, 5 µm.
Figure 6
Figure 6. Transfected DNA co-localizes with STING and TBK1.
(A) IL2/PHA PBMCs were left untreated or treated with Lipofectamine2000 for 2 hours prior to fixation and staining with anti-STING antibody (Green). (B) IL2/PHA PBMCs transfected with 2 µg/mL of FITC-labeled DNA as indicated for 2 hours were fixed and stained with anti-IFI16 and anti-STING antibodies (upper panel) or anti-STING and anti-TBK1 antibodies (lower panel) and visualized by confocal microscopy. STING is shown in green, IFI16 and TBK1 in red, and DNA in white. (C) Percentage co-localization of cytoplasmic spots positive for the respective staining was quantified by counting more than 100 cells per donor in 3 different donors. Data is shown as means +/− SD Scale bar, 5 µm. (D) Whole cell lysates of IL2/PHA PBMCs from 2 donors and PMA-differentiated THP1 cells treated with ssDNA (2 µg/mL) for 2 h were analyzed for levels of phosphorylated TBK1 by Western Blotting.
Figure 7
Figure 7. Type I IFN induces ISGs and inhibits HIV-1 BaL replication in IL2/PHA PBMCs.
(A) IL2/PHA PBMCs were infected with SeV (MOI 0.5) or treated with IFNα (20 ng/mL). Total RNA was harvested after 6 hours for RT-qPCR measurements of ISG56 mRNA. (B) IL2/PHA PBMCs were pre-treated with IFNβ in increasing doses 16 hours prior to infection with HIV-1 Bal (MOI 0.002). Levels of p24 were measured in the supernatants 72 hours post infection. (C–E) IL2/PHA PBMCs were infected with HIV-1 BaL (MOI 0.002) or SeV (MOI 0.5) or mock infected. Total RNA was harvested after 12, 24, and 36 hours for RT-qPCR measurements of (C) ISG56, (D) CXCL10, and (E) viperin mRNAs.

References

    1. Barre-Sinoussi F, Chermann JC, Rey F, Nugeyre MT, Chamaret S, et al. (1983) Isolation of a T-lymphotropic retrovirus from a patient at risk for acquired immune deficiency syndrome (AIDS). Science 220: 868–871. - PubMed
    1. De Cock KM, Jaffe HW, Curran JW (2012) The evolving epidemiology of HIV/AIDS. AIDS 26: 1205–1213. - PubMed
    1. Mogensen TH, Melchjorsen J, Larsen CS, Paludan SR (2010) Innate immune recognition and activation during HIV infection. Retrovirology 7: 54. - PMC - PubMed
    1. Brenchley JM, Schacker TW, Ruff LE, Price DA, Taylor JH, et al. (2004) CD4+ T cell depletion during all stages of HIV disease occurs predominantly in the gastrointestinal tract. J Exp Med 200: 749–759. - PMC - PubMed
    1. Ho DD, Neumann AU, Perelson AS, Chen W, Leonard JM, et al. (1995) Rapid turnover of plasma virions and CD4 lymphocytes in HIV-1 infection. Nature 373: 123–126. - PubMed

Publication types

MeSH terms