. 2014 Jan 3;9(1):e85188.
doi: 10.1371/journal.pone.0085188. eCollection 2014.

Functional expression of Rat Nav1.6 voltage-gated sodium channels in HEK293 cells: modulation by the auxiliary β1 subunit

Affiliations

Functional expression of Rat Nav1.6 voltage-gated sodium channels in HEK293 cells: modulation by the auxiliary β1 subunit

Bingjun He et al. PLoS One. .

Abstract

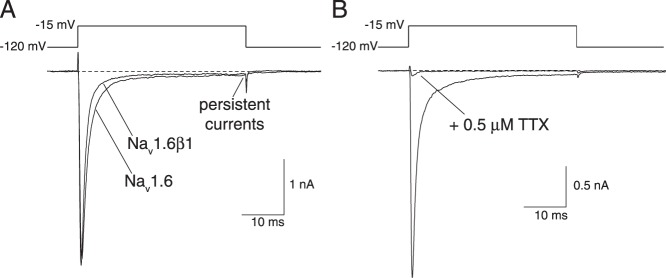
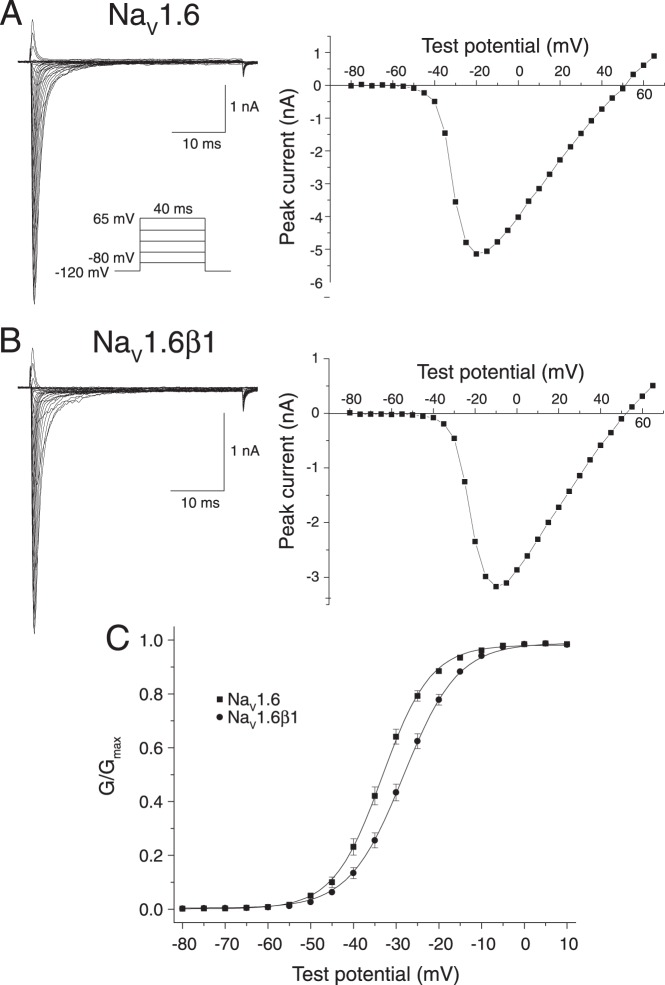
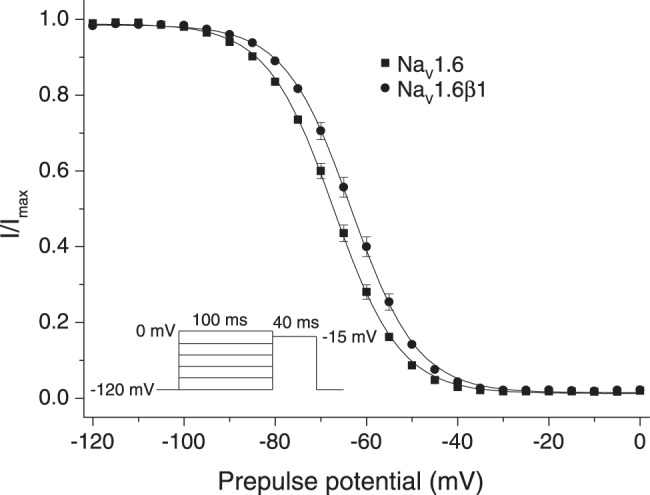
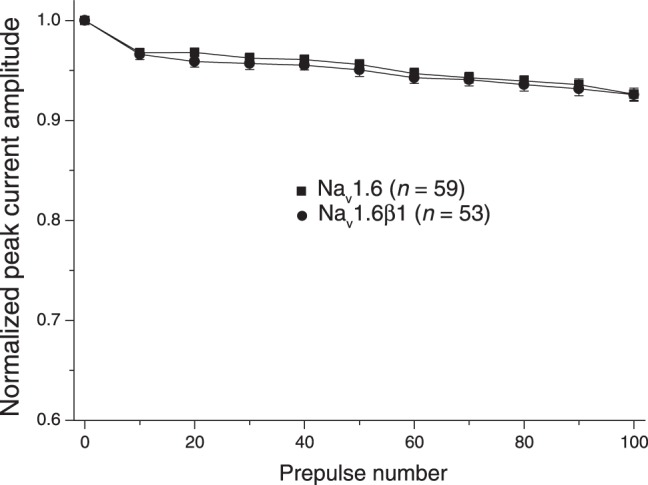
The Nav1.6 voltage-gated sodium channel α subunit isoform is abundantly expressed in the adult rat brain. To assess the functional modulation of Nav1.6 channels by the auxiliary β1 subunit we expressed the rat Nav1.6 sodium channel α subunit by stable transformation in HEK293 cells either alone or in combination with the rat β1 subunit and assessed the properties of the reconstituted channels by recording sodium currents using the whole-cell patch clamp technique. Coexpression with the β1 subunit accelerated the inactivation of sodium currents and shifted the voltage dependence of channel activation and steady-state fast inactivation by approximately 5-7 mV in the direction of depolarization. By contrast the β1 subunit had no effect on the stability of sodium currents following repeated depolarizations at high frequencies. Our results define modulatory effects of the β1 subunit on the properties of rat Nav1.6-mediated sodium currents reconstituted in HEK293 cells that differ from effects measured previously in the Xenopus oocyte expression system. We also identify differences in the kinetic and gating properties of the rat Nav1.6 channel expressed in the absence of the β1 subunit compared to the properties of the orthologous mouse and human channels expressed in this system.


Conflict of interest statement

Competing Interests: The authors declare that no competing interests exist.

Figures

Figure 1
Figure 1. Sodium currents recorded from HEK-Nav1.6 and HEK-Nav1.6β1 cells.
(A) Representative sodium current traces recorded from HEK-Nav1.6 and HEK-Nav1.6β1 cells following 40-ms depolarizations from −120 mV to −15 mV. (B) Sodium currents recorded from a HEK-Nav1.6β1 cell before and after exposure to 0.5 µM TTX. Dashed lines indicate zero current.
Figure 2
Figure 2. Voltage-dependent activation of Nav1.6 and Nav1.6β1 sodium channels expressed in HEK293 cells.
(A) Representative current traces recorded from a HEK-Nav1.6 cell using the indicated pulse protocol (left) and the plot of peak sodium current in these traces as a function of test potential (right). (B) Representative current traces recorded from a HEK-Nav1.6β1 cell using the pulse protocol shown in Panel A and the plot of peak sodium current in these traces as a function of test potential. (C) Conductance – voltage plots for the activation of Nav1.6 and Nav1.6β1 channels. Peak sodium currents such as those in Panels A and B were transformed to conductances (G) using the equation G = I/(Vt–Vrev), where I is the peak current, Vrev is the reversal potential, and Vt is the voltage of the test potential; conductances were then normalized to the maximum conductance (Gmax) for that cell. Values are means of 64 (Nav1.6) or 65 (Nav1.6β1) separate experiments with different cells; bars show SE values larger than the data point symbols. Curves were fitted to the mean values using the Boltzmann equation.
Figure 3
Figure 3. Voltage-dependent steady-state fast inactivation of Nav1.6 and Nav1.6β1 sodium channels expressed in HEK293 cells.
Amplitudes of peak transient currents obtained using the indicated pulse protocol are plotted as a function of prepulse potential. Values are means of 63 (Nav1.6) or 66 (Nav1.6β1) separate experiments with different cells; bars show SE values larger than the data point symbols. Curves were fitted to the mean values using the Boltzmann equation.
Figure 4
Figure 4. Effect of repeated depolarization on the stability of sodium currents recorded from HEK293 cells expressing Nav1.6 and Nav1.6β1 sodium channels.
Sodium currents were recorded during a 40-ms step depolarization from −120 mV to −15 mV following 0–100 conditioning prepulses (5-ms pulses from −120 mV to 10 mV at 20 Hz). Currents for each cell were normalized to the amplitude of the peak current obtained prior to repeated depolarization. Values are means of the indicated number of separate experiments with different cells; bars show SE values larger than the data point symbols.

References

    1. Hille B (2001) Ion Channels of Excitable Membranes. SunderlandMA: Sinauer. 814 p.
    1. Catterall WA (2000) From ionic currents to molecular mechanisms: structure and function of voltage-gated sodium channels. Neuron 26: 13–25. - PubMed
    1. Patino GA, Isom LL (2010) Electrophysiology and beyond: multiple roles of Na+ channel β subunits in development and disease. Neuroscience Letters 486: 53–59. - PMC - PubMed
    1. Goldin AL (2001) Resurgence of sodium channel research. Annual Review of Physiology 63: 871–894. - PubMed
    1. Yu FH, Catterall WA (2003) Overview of the voltage-gated sodium channel family. Genome Biology 4: 207.201–207.207. - PMC - PubMed

Publication types

Substances

LinkOut - more resources