Diffusion Tensor Imaging of the Kidneys: Influence of b-Value and Number of Encoding Directions on Image Quality and Diffusion Tensor Parameters
- PMID: 24404412
- PMCID: PMC3883273
- DOI: 10.4103/2156-7514.122323
Diffusion Tensor Imaging of the Kidneys: Influence of b-Value and Number of Encoding Directions on Image Quality and Diffusion Tensor Parameters
Abstract
Objectives: The purpose of this study was to evaluate to which degree investment of acquisition time in more encoding directions leads to better image quality (IQ) and what influence the number of encoding directions and the choice of b-values have on renal diffusion tensor imaging (DTI) parameters.
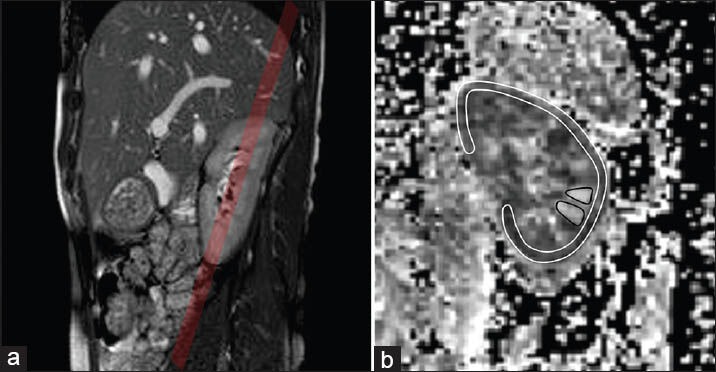
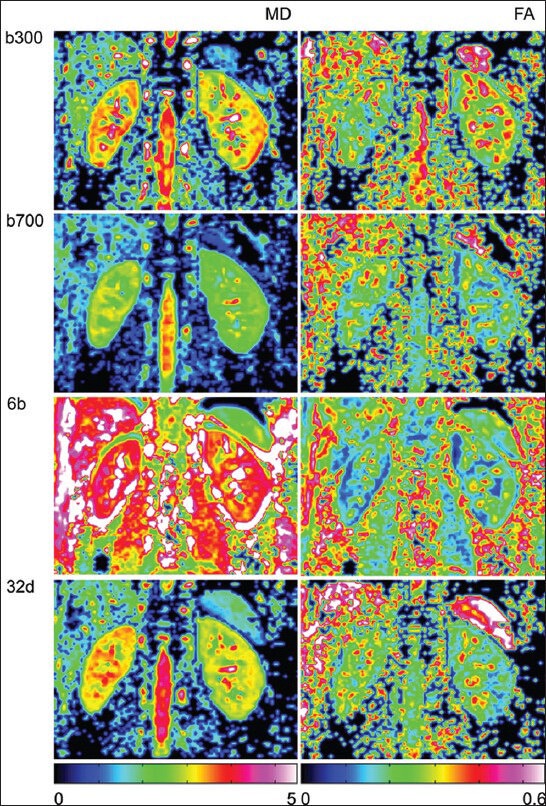
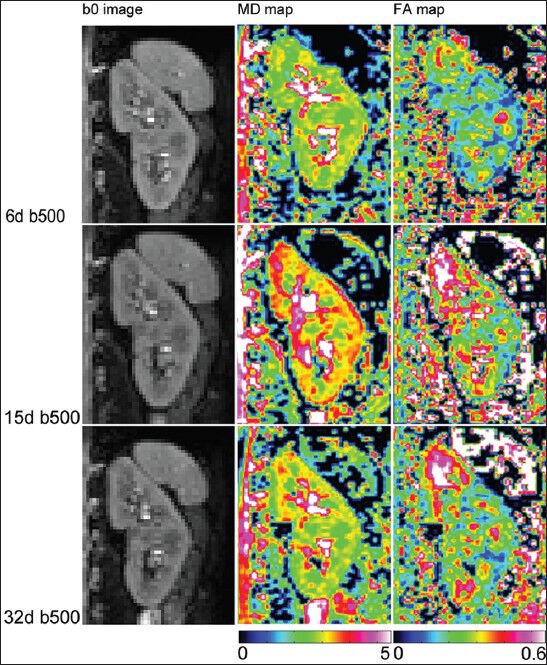
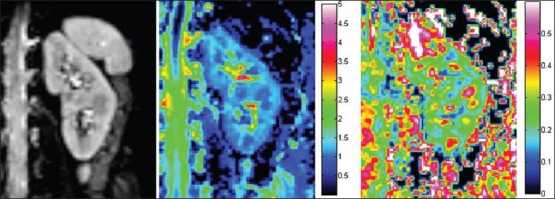
Material and methods: Eight healthy volunteers (32.3 y ± 5.1 y) consented to an examination in a 1.5T whole-body MR scanner. Coronal DTI data sets of the kidneys were acquired with systematic variation of b-values (50, 150, 300, 500, and 700 s/mm(2)) and number of diffusion-encoding directions (6, 15, and 32) using a respiratory-triggered echo-planar sequence (TR/TE 1500 ms/67 ms, matrix size 128 × 128). Additionally, two data sets with more than two b-values were acquired (0, 150, and 300 s/mm(2) and all six b-values). Parametrical maps were calculated on a pixel-by-pixel basis. Image quality was determined with a reader score.
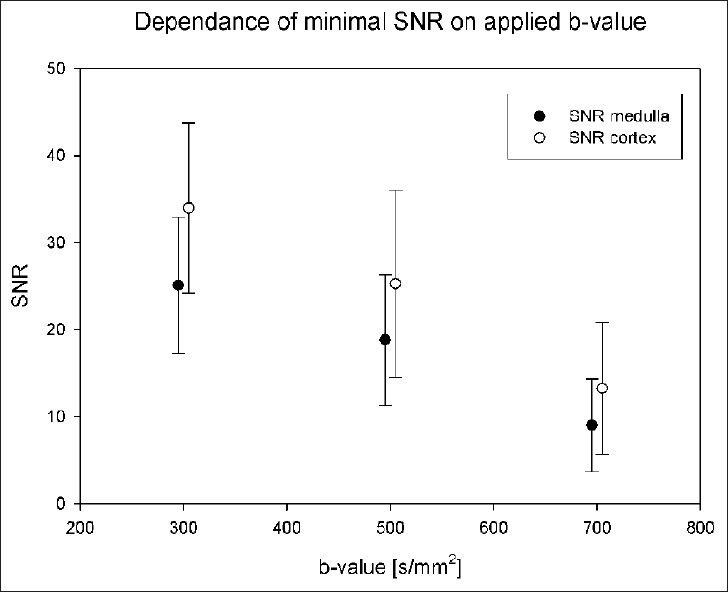
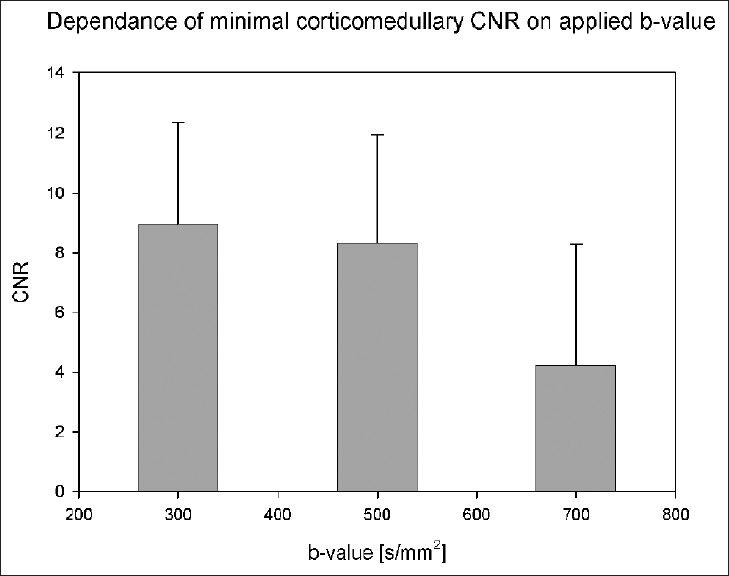
Results: Best IQ was visually assessed for images acquired with 15 and 32 encoding directions, whereas images acquired with six directions had significantly lower IQ ratings. Image quality, fractional anisotropy, and mean diffusivity only varied insignificantly for b-values between 300 and 500 s/mm(2). In the renal medulla fractional anisotropy (FA) values between 0.43 and 0.46 and mean diffusivity (MD) values between 1.8-2.1 × 10(-3) mm(2)/s were observed. In the renal cortex, the corresponding ranges were 0.24-0.25 (FA) and 2.2-2.8 × 10(-3) mm(2)/s (MD). Including b-values below 300 s/mm(2), notably higher MD values were observed, while FA remained constant. Susceptibility artifacts were more prominent in FA maps than in MD maps.
Conclusion: In DTI of the kidneys at 1.5T, the best compromise between acquisition time and resulting image quality seems the application of 15 encoding directions with b-values between 300 and 500 s/mm(2). Including lower b-values allows for assessment of fast diffusing spin components.
Keywords: Diffusion tensor imaging; diffusion weighted imaging; kidneys.
Conflict of interest statement
Figures
References
-
- Michaely HJ, Herrmann KA, Nael K, Oesingmann N, Reiser MF, Schoenberg SO. Functional renal imaging: Nonvascular renal disease. Abdom Imaging. 2007;32:1–16. - PubMed
-
- Lorenz CH, Powers TA, Partain CL. Quantitative imaging of renal blood flow and function. Invest Radiol. 1992;27(Suppl 2):S109–14. - PubMed
-
- Carbone SF, Gaggioli E, Ricci V, Mazzei F, Mazzei MA, Volterrani L. Diffusion-weighted magnetic resonance imaging in the evaluation of renal function: A preliminary study. Radiol Med. 2007;112:1201–10. - PubMed
-
- Zhang J, Tehrani YM, Wang L, Ishill NM, Schwartz LH, Hricak H. Renal masses: Characterization with diffusion-weighted MR imaging: A preliminary experience. Radiology. 2008;247:458–64. - PubMed
-
- Thoeny HC, De Keyzer F, Oyen RH, Peeters RR. Diffusion-weighted MR imaging of kidneys in healthy volunteers and patients with parenchymal diseases: Initial experience. Radiology. 2005;235:911–7. - PubMed
LinkOut - more resources
Full Text Sources
Other Literature Sources