. 2014 Mar 21;9(3):802-11.
doi: 10.1021/cb400728e. Epub 2014 Jan 17.

Discovery of highly potent p53-MDM2 antagonists and structural basis for anti-acute myeloid leukemia activities

Affiliations

Discovery of highly potent p53-MDM2 antagonists and structural basis for anti-acute myeloid leukemia activities

Yijun Huang et al. ACS Chem Biol. .

Abstract

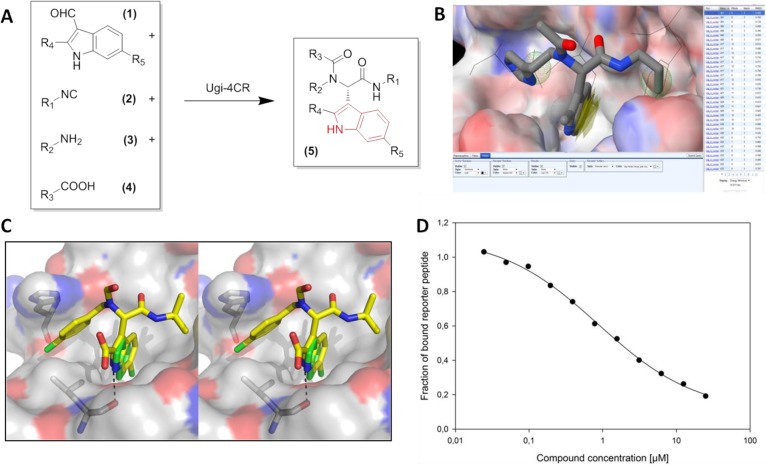
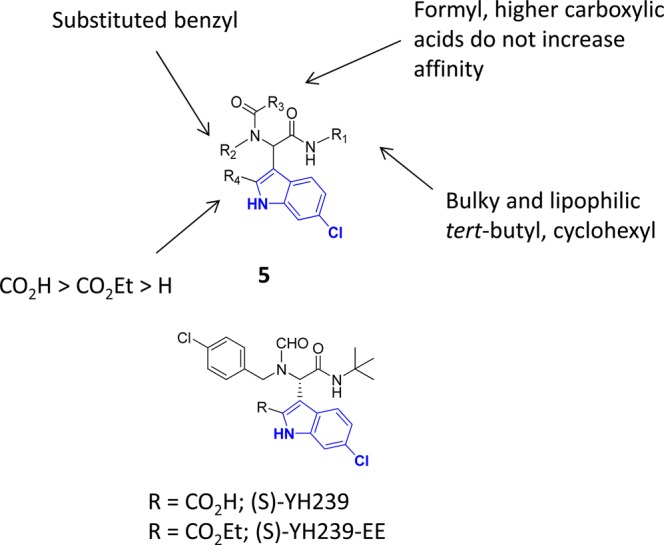
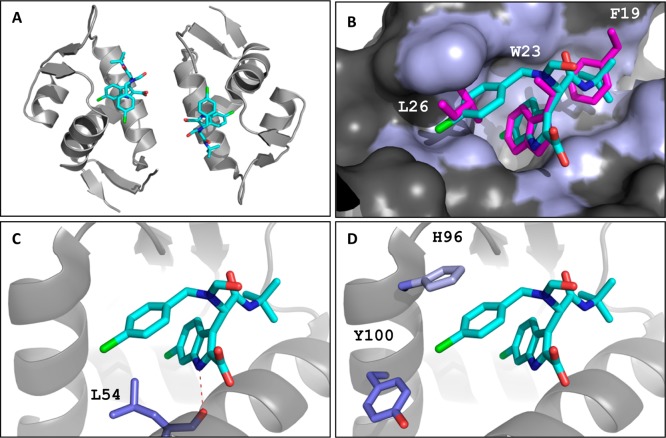
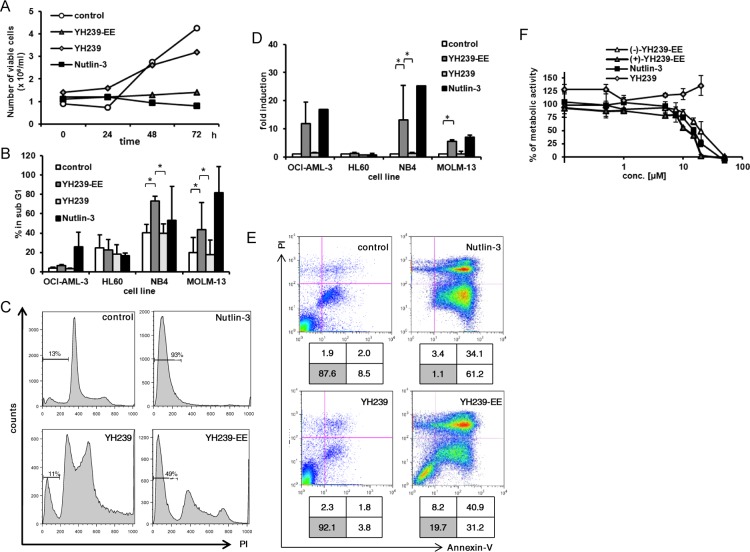
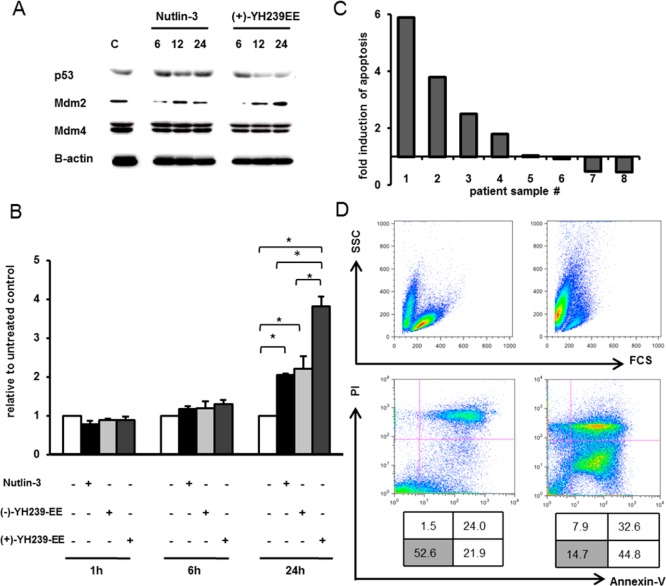
The inhibition of p53-MDM2 interaction is a promising new approach to non-genotoxic cancer treatment. A potential application for drugs blocking the p53-MDM2 interaction is acute myeloid leukemia (AML) due to the occurrence of wild type p53 (wt p53) in the majority of patients. Although there are very promising preclinical results of several p53-MDM2 antagonists in early development, none of the compounds have yet proven the utility as a next generation anticancer agent. Herein we report the design, synthesis and optimization of YH239-EE (ethyl ester of the free carboxylic acid compound YH239), a potent p53-MDM2 antagonizing and apoptosis-inducing agent characterized by a number of leukemia cell lines as well as patient-derived AML blast samples. The structural basis of the interaction between MDM2 (the p53 receptor) and YH239 is elucidated by a co-crystal structure. YH239-EE acts as a prodrug and is the most potent compound that induces apoptosis in AML cells and patient samples. The observed superior activity compared to reference compounds provides the preclinical basis for further investigation and progression of YH239-EE.


Figures

Figure 1
Figure 1
(A) Convergent Ugi-4CR for the rapid synthesis of indole-derived MDM2 antagonists. The anchoring residue is indicated in red. (B) Screenshot of a high ranking Ugi scaffold hit of the ANCHOR.QUERY software. (C) Stereo picture of the co-crystal structure of (S)-YH239 (yellow sticks) in MDM2 (gray, blue, and red surface with the amino acids His96 and Leu54 shown as sticks, PDB ID: 3TJ2). For comparison, the indole ring of Trp23 from the p53-MDM2 complex (PDB ID: 1YCR) is aligned and shown in green sticks. The hydrogen bond between the indole fragment and the carbonyl of Leu54 is indicated by a black dotted line (d = 2.95 Å). (D) FP assay of YH239. The normalized value of ″fraction of reporter peptide bound″ is reported on the y-axis instead of the usual raw mP values due to the fact that the raw mP value fluctuates slightly from experiment to experiment due to changing the active protein concentration and hardware issues. The FP experiments are run in triplicates, and the accuracy errors are ±10%.
Figure 2
Figure 2
Summarized SAR of scaffold 5 (above) and structures of optimized lead compound YH239 and its ethyl ester YH239-EE (below).
Figure 3
Figure 3
Crystallographic interaction of the MDM2 receptor and (S)-YH239 (cyan sticks). (A) Overall view of the crystallographic MDM2 complex dimer. (B) Alignment of the p53 hot spot triad F19W23L26 (magenta sticks, PDB ID: 1YCR) with MDM2-YH239. A 4 Å radius around YH239 is shown as blue surface representation. (C) L54 (blue sticks) undergoes hydrophobic contacts to the 4-chlorobenzyl group and forms a hydrogen bond (red dotted line) to the indole NH (2.9 Å). (D) H96 (blue sticks) is aligning parallel to the benzyl group and forming short contacts (Å). Y100 (blue sticks) is in the characteristic inside-out conformation.
Figure 4
Figure 4
(A) Biological activity of YH239-EE. YH239-EE inhibits the growth of OCI-AML-3 cells with wild type p53 by inhibiting the p53-MDM2 interaction. Diagram of effects in OCI-AML-3 cell line by Nutlin-3 (black square), YH239 (light gray rhombus), and YH239-EE (dark gray triangle) compared to the untreated control (white circle). The cells were incubated with the substances in a concentration of 20 μM at different time points. The cell viability was determined by staining with Trypan blue. (B) Cell cycle analysis of YH239-EE. The bar chart represents the percentages of the cells in the sub G1 phase in the four different AML cell lines OCI-AML-3 (wild type p53), HL60 (deleted p53), NB4 (mutated p53), and MOLM-13 (wt p53). The cells were treated for 24 h with 20 μM Nutlin-3 (black square), YH239 (light gray square), or YH239-EE (dark gray square) or were left untreated (white square). The cells were fixed in ice-cold ethanol and stained with propidium iodide (PI), and the DNA content was analyzed by flow cytometry. All values are given as means (n = 3) with the standard deviations. (C) Cell cycle state of the most sensitive cell line MOLM-13 (wt p53). After treatment with 20 μM Nutlin-3, YH239 and YH239-EE, the cells were fixed, stained with propidium iodide, and treated with RNase. The cells in the subG1 phase were gated. Untreated cells were used as control. (D) Induction of apoptosis in the four different AML cell lines OCI-AML-3 (wt p53), HL60 (deleted p53), NB4 (mutated p53) and MOLM-13 (wt p53). The cells were treated with 20 μM Nutlin-3 (black bar), YH239-EE (dark gray bar), and YH239 (light gray bar) for 72 h. The samples were prepared for Annexin-V and PI staining and analyzed by flow cytometry. The data represent the total of Annexin-V and PI positive/apoptotic and necrotic cells in relation to untreated control set as 1. All values are given as means (n = 3) with the standard deviations. (E) Induction of apoptosis in the most sensitive MOLM-13 (wt p53) cells analyzed by flow cytometry. The cells were treated as in panel D. The boxes contain the number of cells belonging to each quadrant in %. (F) The biological activity of the compounds Nutlin-3 (black square), YH239 (light gray rhombus), (−)-YH239-EE(white triangle), and (+)-YH239-EE (dark gray triangle) was analyzed by measuring the turnover of WST-1 to formazan depending on the cell metabolism in the MOLM-13 cells after 48 h. All values are given as means (n = 3) with the standard deviations.
Figure 5
Figure 5
(A) Induction of p53 and downstream target. Western blot analysis of p53, MDM2, and MDM4 on MOLM-13 cells. The cells were treated with 20 μM Nutlin-3 or (+)-YH239-EE or left untreated and were harvested and lysed after 6, 12, and 24 h. The expression of apoptosis-associated proteins was analyzed by Western blot. (B) Induction of the downstream target proteins caspase 3 and 7 in MOLM-13 cells under treatment with Nutlin-3, (−)-YH239-EE, and (+)-YH239-EE. The cells were incubated for 1, 6, and 24 h with a concentration of 20 μM. The caspase activation was assessed with the CaspaseGlo 3/7 assay and is illustrated relative to untreated control set as 1. The bars represent means (n = 3) and standard deviations, *p < 0.05. (C) Induction of apoptosis in AML blasts. The blasts derived from bone marrow or peripheral blood were cultivated on a mouse fibroblast feeder layer, and cell growth was stimulated with an AML cytokine mix. The blasts were treated with (+)-YH239-EE at a concentration of 20 μM. After 72 h the blasts were harvested and stained with Annexin-V, and PI was analyzed by flow cytometry. The bar chart shows the fold induction of apoptosis in primary AML blasts 1–8. The Annexin-V and PI positive blasts were counted and compared with the untreated control set as 1. (D) Exemplary effect of (+)-YH239-EE on patient sample 4 compared to untreated control is shown after treatment for 72 h. The upper row shows the induction of apoptosis in FCS/SSC, and the lower row shows the Annexin-V/PI staining. The boxes contain the number of blasts belonging to each quadrant.

Similar articles

Cited by

References

    1. Wang S., Zhao Y., Bernard D., Aguilar A., and Kumar S. (2009) Targeting the MDM2-p53 protein-protein interaction for new cancer therapeutics, in Protein-Protein Interactions (Wendt M. D., Ed.) Vol. 8, pp 57–79, Springer, Berlin, Heidelberg.
    1. Bueso-Ramos C. E.; Yang Y.; deLeon E.; McCown P.; Stass S. A.; Albitar M. (1993) The human MDM-2 oncogene is overexpressed in leukemias. Blood 82, 2617–2623. - PubMed
    1. Joerger A. C.; Fersht A. R. (2008) Structural biology of the tumor suppressor p53. Annu. Rev. Biochem. 77, 557–582. - PubMed
    1. Joerger A. C.; Fersht A. R. (2010) The tumor suppressor p53: from structures to drug discovery. Cold Spring Harb. Perspect. Biol 2, a000919. - PMC - PubMed
    1. Secchiero P.; Zerbinati C.; Melloni E.; Milani D.; Campioni D.; Fadda R.; Tiribelli M.; Zauli G. (2007) The MDM-2 antagonist nutlin-3 promotes the maturation of acute myeloid leukemic blasts. Neoplasia 9, 853–861. - PMC - PubMed

Publication types

MeSH terms

Substances