Comparative Study
. 2014 Jan 9:12:5.
doi: 10.1186/1741-7015-12-5.

Using verbal autopsy to measure causes of death: the comparative performance of existing methods

Affiliations
Comparative Study

Using verbal autopsy to measure causes of death: the comparative performance of existing methods

Christopher J L Murray et al. BMC Med. .

Abstract

Background: Monitoring progress with disease and injury reduction in many populations will require widespread use of verbal autopsy (VA). Multiple methods have been developed for assigning cause of death from a VA but their application is restricted by uncertainty about their reliability.

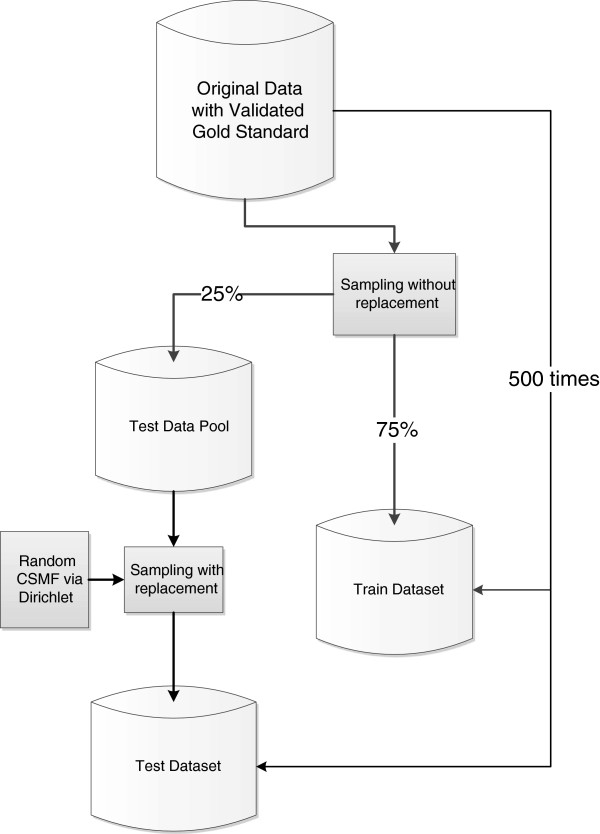
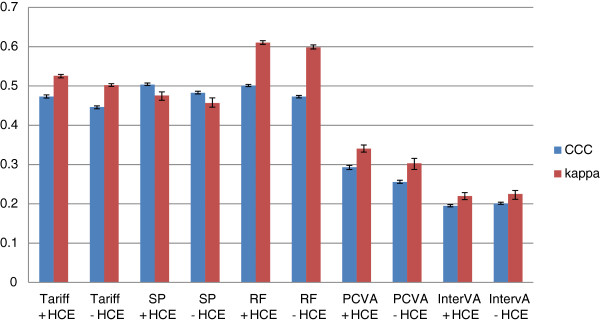
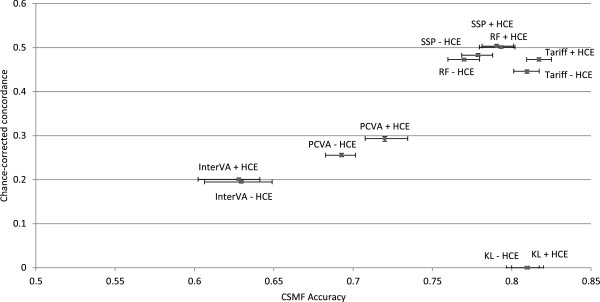
Methods: We investigated the validity of five automated VA methods for assigning cause of death: InterVA-4, Random Forest (RF), Simplified Symptom Pattern (SSP), Tariff method (Tariff), and King-Lu (KL), in addition to physician review of VA forms (PCVA), based on 12,535 cases from diverse populations for which the true cause of death had been reliably established. For adults, children, neonates and stillbirths, performance was assessed separately for individuals using sensitivity, specificity, Kappa, and chance-corrected concordance (CCC) and for populations using cause specific mortality fraction (CSMF) accuracy, with and without additional diagnostic information from prior contact with health services. A total of 500 train-test splits were used to ensure that results are robust to variation in the underlying cause of death distribution.

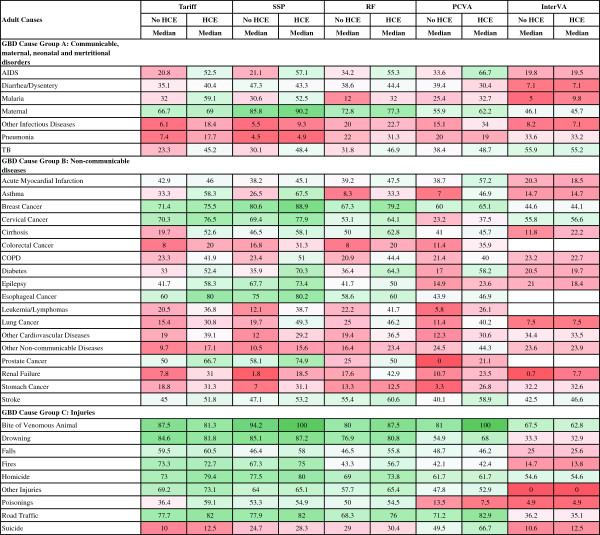
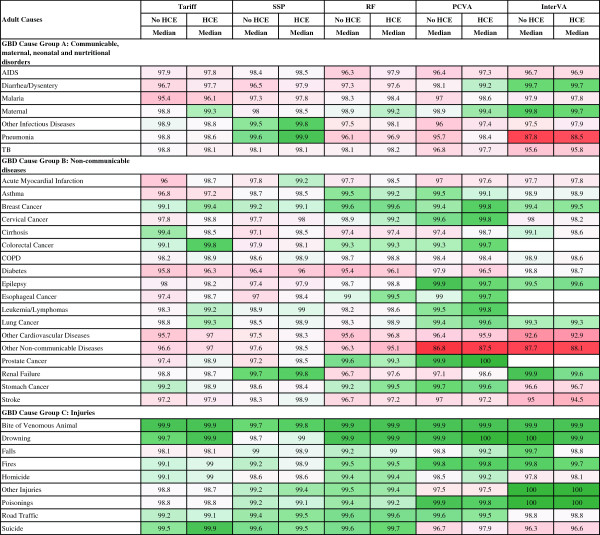
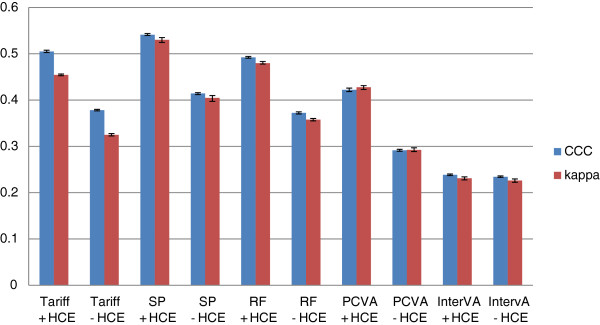
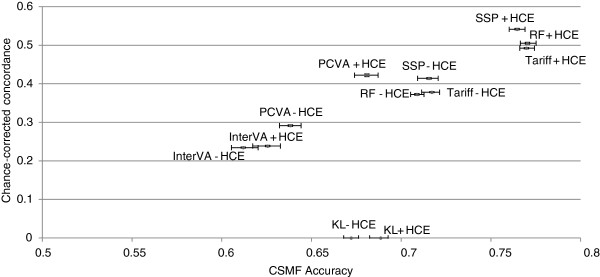
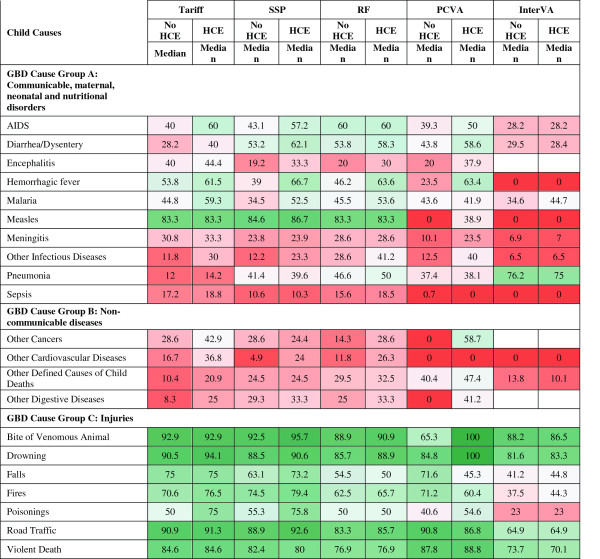
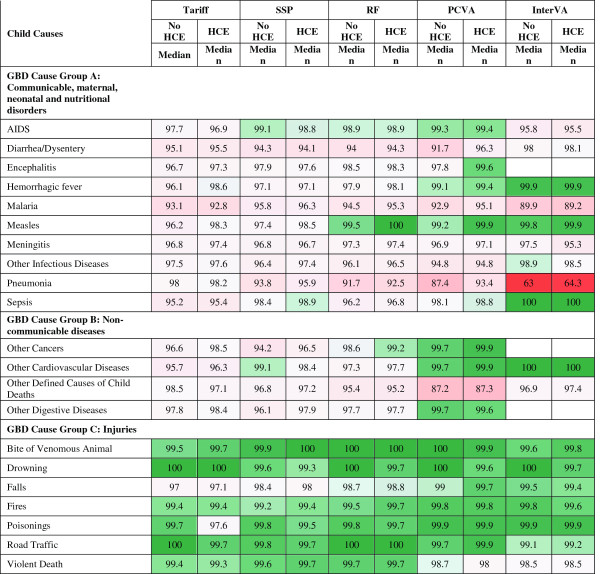
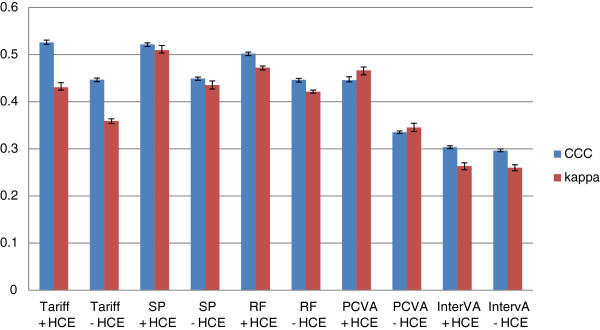
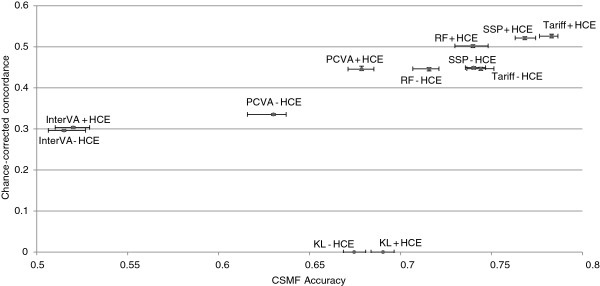
Results: Three automated diagnostic methods, Tariff, SSP, and RF, but not InterVA-4, performed better than physician review in all age groups, study sites, and for the majority of causes of death studied. For adults, CSMF accuracy ranged from 0.764 to 0.770, compared with 0.680 for PCVA and 0.625 for InterVA; CCC varied from 49.2% to 54.1%, compared with 42.2% for PCVA, and 23.8% for InterVA. For children, CSMF accuracy was 0.783 for Tariff, 0.678 for PCVA, and 0.520 for InterVA; CCC was 52.5% for Tariff, 44.5% for PCVA, and 30.3% for InterVA. For neonates, CSMF accuracy was 0.817 for Tariff, 0.719 for PCVA, and 0.629 for InterVA; CCC varied from 47.3% to 50.3% for the three automated methods, 29.3% for PCVA, and 19.4% for InterVA. The method with the highest sensitivity for a specific cause varied by cause.

Conclusions: Physician review of verbal autopsy questionnaires is less accurate than automated methods in determining both individual and population causes of death. Overall, Tariff performs as well or better than other methods and should be widely applied in routine mortality surveillance systems with poor cause of death certification practices.


Figures

Figure 1
Figure 1
Process of generating 500 test and train validation datasets. A detailed flowchart illustrating the process by which 500 different populations with different cause distributions were simulated in order to validate the analytical models in 500 separate scenarios.
Figure 2
Figure 2
Estimated cause-specific mortality fraction (CSMF) versus true CSMF example. A graphical example of the regression of the estimated over true CSMF. This particular example is for the estimation of epilepsy using SSP without HCE. Each dot represents a single split, or simulated population, and SSP’s estimate of fraction of epilepsy in the population as compared to the true fraction. The red line represents a perfect estimate while the blue line represents a line of best fit for the data. HCE, health care experience; SSP, Simplified Symptom Pattern.
Figure 3
Figure 3
Sensitivity (%) for 5 methods for 34 adult causes. Figure 3 shows the median sensitivity for each method (except King-Lu which does not provide individual cause of death assignments) for 34 adult causes. Cells are shaded from red (low sensitivity) to green (high sensitivity) to help identify the relative differences between sensitivities across methods and causes. COPD, chronic obstructive pulmonary disease; GBD, Global Burden of Disease; HCE, health care experience; PCVA, physician certified VA; RF, Random Forest; SSP, Simplified Symptom Pattern; TB, tuberculosis.
Figure 4
Figure 4
Specificity (%) for 5 methods for 34 adult causes. Figure 4 shows the median specificity for each method (except King-Lu which does not provide individual cause of death assignments) for 34 adult causes. Cells are shaded from red (low specificity) to green (high specificity) to help identify the relative differences between specificities across methods and causes. COPD, chronic obstructive pulmonary disease; GBD, Global Burden of Disease; HCE, health care experience; PCVA, physician-certified VA; RF, Random Forest; SSP, Simplified Symptom Pattern; TB, tuberculosis; VA, verbal autopsy.
Figure 5
Figure 5
Histogram of adult Cohen’s kappa and CCC for 5 analytical methods across 500 splits. Comparative performance of five methods according to Cohen’s kappa (%) and chance-corrected concordance (%) for adult causes with and without health care experience (HCE).
Figure 6
Figure 6
Plot of adult CCC and CSMF accuracy for 6 analytical methods across 500 splits. Comparative performance of six methods according to chance-corrected concordance (%) and cause-specific mortality fraction accuracy for adult causes with and without health care experience (HCE). CCC, chance-corrected concordance; CSMF, cause-specific mortality fraction.
Figure 7
Figure 7
Sensitivity (%) for 5 methods for 21 child causes. Figure 7 shows the median sensitivity for each method (except King-Lu which does not provide individual cause of death assignments) for 21 child causes. Cells are shaded from red (low sensitivity) to green (high sensitivity) to help identify the relative differences between sensitivities across methods and causes. GBD, Global Burden of Disease; HCE, health care experience; PCVA, physician-certified VA; RF, Random Forest; SSP, Simplified Symptom Pattern; VA, verbal autopsy.
Figure 8
Figure 8
Specificity (%) for 5 methods for 21 child causes. Figure 8 shows the median specificity for each method (except King-Lu which does not provide individual cause of death assignments) for 21 child causes. Cells are shaded from red (low specificity) to green (high specificity) to help identify the relative differences between specificities across methods and causes. GBD, Global Burden of Disease; HCE, health care experience; PCVA, physician-certified VA; RF, Random Forest; SSP, Simplified Symptom Pattern; VA, verbal autopsy.
Figure 9
Figure 9
Histogram of child Cohen’s kappa and CCC for 5 analytical methods across 500 splits. Comparative performance of five methods according to Cohen’s kappa (%) and chance-corrected concordance (%) for child causes with and without health care experience (HCE). CCC, chance-corrected concordance.
Figure 10
Figure 10
Plot of child CCC and CSMF accuracy for 6 analytical methods across 500 splits. Comparative performance of six methods according to chance-corrected concordance (%) and cause-specific mortality fraction accuracy for child causes with and without health care experience (HCE). CCC, chance-corrected concordance; CSMF, cause-specific mortality fraction.
Figure 11
Figure 11
Sensitivity (%) for five methods for six neonatal causes. Figure 11 shows the median sensitivity for each method (except King-Lu which does not provide individual cause of death assignments) for five neonatal causes and stillbirth. Cells are shaded from red (low sensitivity) to green (high sensitivity) to help identify the relative differences between sensitivities across methods and causes. HCE, health care experience; PCVA, physician-certified VA; RF, Random Forest; SSP, Simplified Symptom Pattern; VA, verbal autopsy.
Figure 12
Figure 12
Specificity (%) for five methods for six neonatal causes. Figure 12 shows the median specificity for each method (except King-Lu which does not provide individual cause of death assignments) for five neonatal causes and stillbirth. Cells are shaded from red (low specificity) to green (high specificity) to help identify the relative differences between specificities across methods and causes. HCE, health care experience; PCVA, physician-certified VA; RF, Random Forest; SSP, Simplified Symptom Pattern; VA, verbal autopsy.
Figure 13
Figure 13
Histogram of neonate Cohen’s kappa and CCC for 5 analytical methods across 500 splits. Comparative performance of five methods according to Cohen’s kappa (%) and chance-corrected concordance (%) for neonatal causes with and without health care experience (HCE). CCC, chance-corrected concordance.
Figure 14
Figure 14
Plot of neonate CCC and CSMF accuracy for 6 analytical methods across 500 splits. Comparative performance of six methods according to chance-corrected concordance (%) and cause-specific mortality fraction accuracy for neonate causes with and without health care experience (HCE). CCC, chance-corrected concordance; CSMF, cause-specific mortality fraction.

References

    1. Ruzicka LT, Lopez AD. The use of cause-of-death statistics for health situation assessment: national and international experiences. World Health Stat Q. 1990;43:249–258. - PubMed
    1. Mathers CD, Fat DM, Inoue M, Rao C, Lopez AD. Counting the dead and what they died from: an assessment of the global status of cause of death data. Bull World Health Organ. 2005;83:171–177. - PMC - PubMed
    1. Mahapatra P, Shibuya K, Lopez AD, Coullare F, Notzon FC, Rao C, Szreter S. Civil registration systems and vital statistics: successes and missed opportunities. Lancet. 2007;370:1653–1663. doi: 10.1016/S0140-6736(07)61308-7. - DOI - PubMed
    1. United Nations. A New Global Partnership: Eradicate Poverty and Transform Economies Through Sustainable Development. New York, NY: United Nations; 2013.
    1. Hernández B, Ramírez-Villalobos D, Romero M, Gómez S, Atkinson C, Lozano R. Assessing quality of medical death certification: concordance between gold standard diagnosis and underlying cause of death in selected Mexican hospitals. Popul Health Metr. 2011;9:38. doi: 10.1186/1478-7954-9-38. - DOI - PMC - PubMed

Publication types

LinkOut - more resources