

Transport of estradiol-17β-glucuronide, estrone-3-sulfate and taurocholate across the endoplasmic reticulum membrane: evidence for different transport systems
- PMID: 24406246
- PMCID: PMC3969151
- DOI: 10.1016/j.bcp.2013.12.026
Transport of estradiol-17β-glucuronide, estrone-3-sulfate and taurocholate across the endoplasmic reticulum membrane: evidence for different transport systems
Abstract
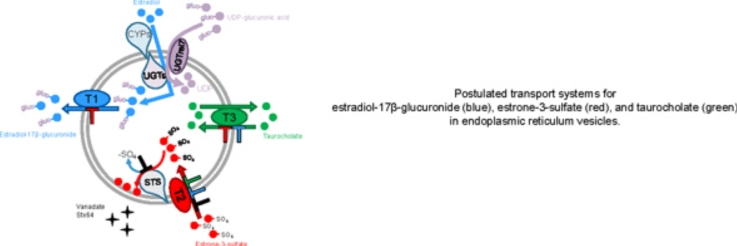
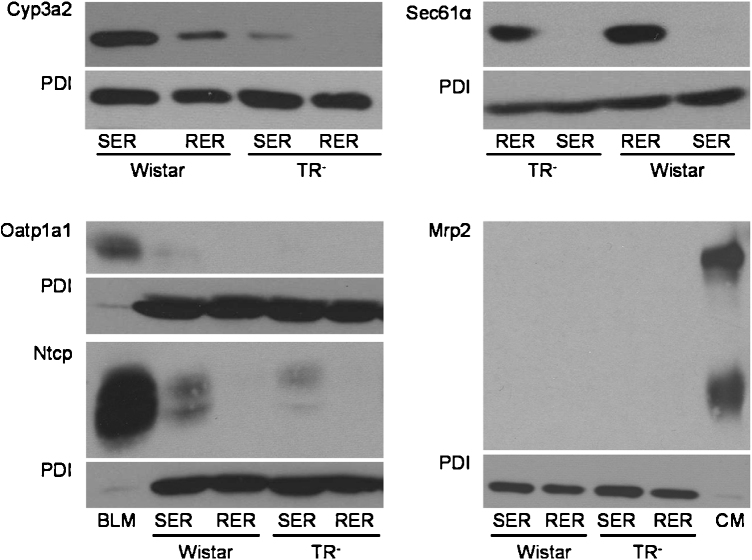
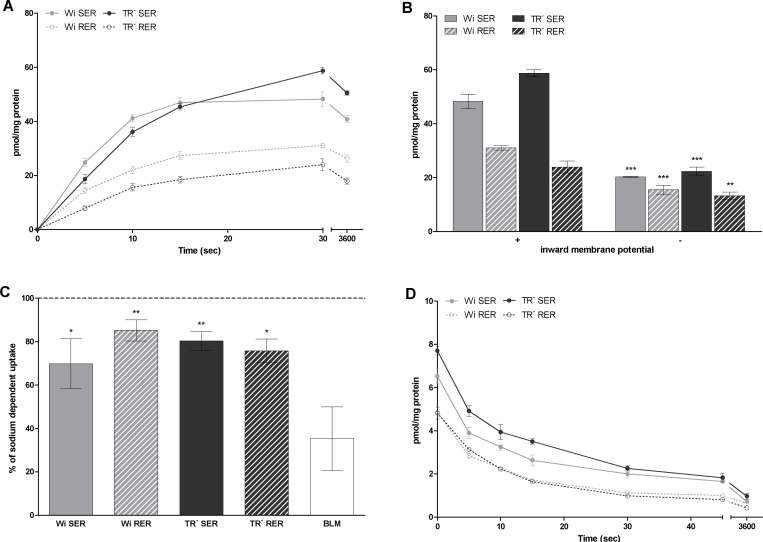
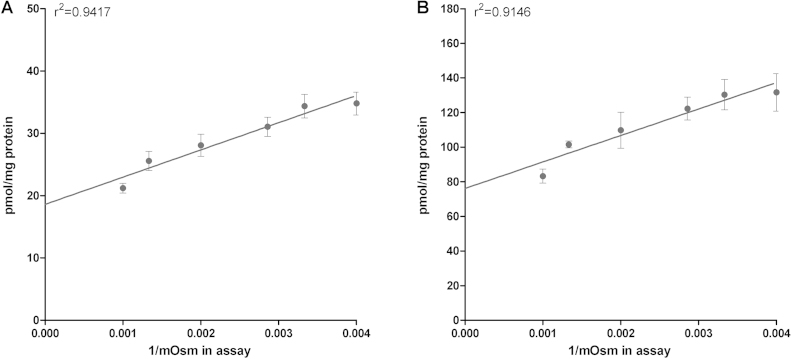
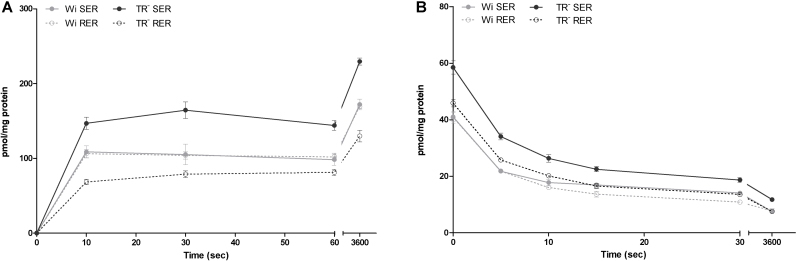
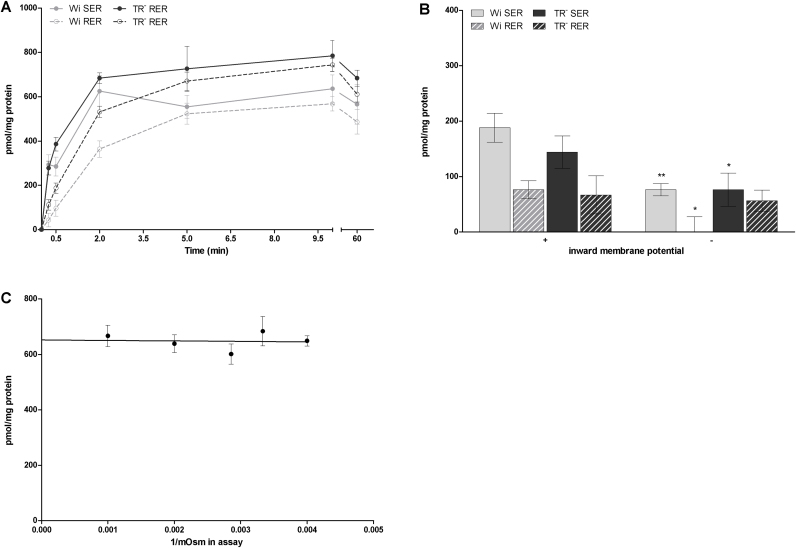
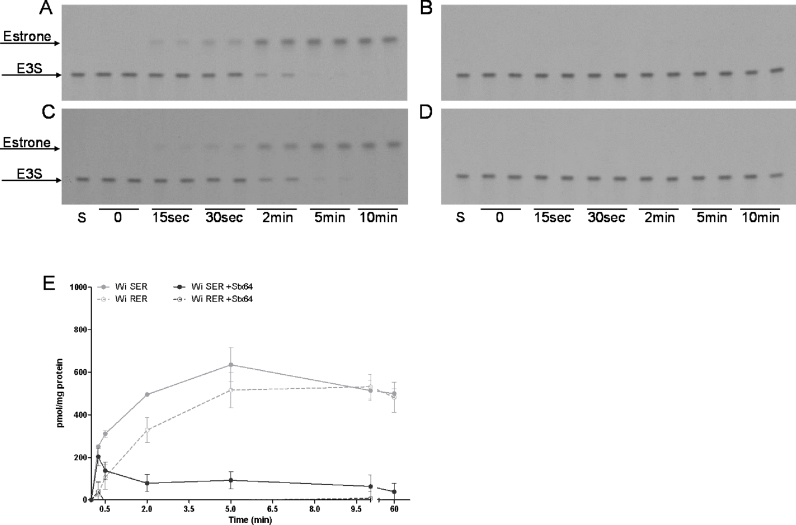
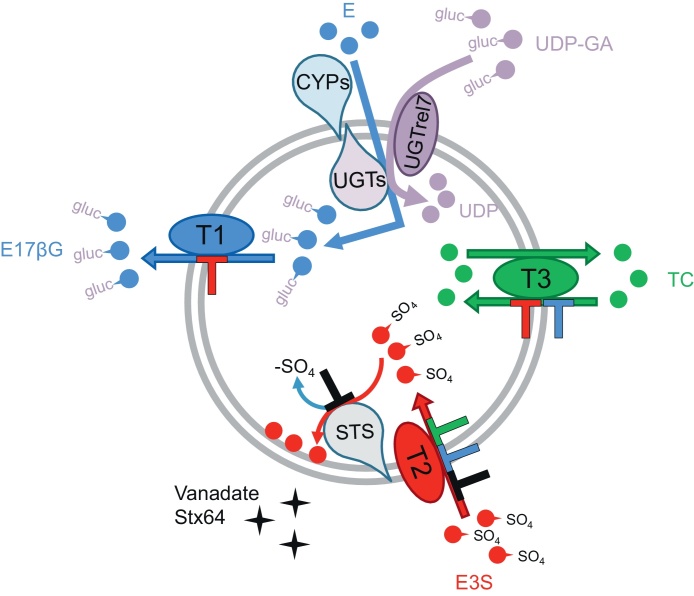
Important reactions of drug metabolism, including UGT mediated glucuronidation and steroidsulfatase mediated hydrolysis of sulfates, take place in the endoplasmic reticulum (ER) of hepatocytes. Consequently, UGT generated glucuronides, like estradiol-17β-glucuronide, have to be translocated back into the cytoplasm to reach their site of excretion. Also steroidsulfatase substrates, including estrone-3-sulfate, have to cross the ER membrane to reach their site of hydrolysis. Based on their physicochemical properties such compounds are not favored for passive diffusion and therefore likely necessitate transport system(s) to cross the ER membrane in either direction. The current study aims to investigate the transport of taurocholate, estradiol-17β-glucuronide, and estrone-3-sulfate in smooth (SER) and rough (RER) endoplasmic reticulum membrane vesicles isolated from Wistar and TR(-) rat liver. Time-dependent and bidirectional transport was demonstrated for taurocholate, showing higher uptake rates in SER than RER vesicles. For estradiol-17β-glucuronide a fast time-dependent efflux with similar efficiencies from SER and RER but no clear protein-mediated uptake was shown, indicating an asymmetric transport system for this substrate. Estrone-3-sulfate uptake was time-dependent and higher in SER than in RER vesicles. Inhibition of steroidsulfatase mediated estrone-3-sulfate hydrolysis decreased estrone-3-sulfate uptake but had no effect on taurocholate or estradiol-17β-glucuronide transport. Based on inhibition studies and transport characteristics, three different transport mechanisms are suggested to be involved in the transport of taurocholate, estrone-3-sulfate and estradiol-17β-glucuronide across the ER membrane.
Keywords: Biotransformation; Endoplasmic reticulum; Estradiol-17β-glucuronide; Estrone-3-sulfate; Liver; Transport.
Copyright © 2014 The Authors. Published by Elsevier Inc. All rights reserved.
Figures
Similar articles
-
Bile acid transport into hepatocyte smooth endoplasmic reticulum vesicles is mediated by microsomal epoxide hydrolase, a membrane protein exhibiting two distinct topological orientations.J Biol Chem. 1993 Sep 25;268(27):20148-55. J Biol Chem. 1993. PMID: 8376374
-
A unique multifunctional transporter translocates estradiol-17beta -glucuronide in rat liver microsomal vesicles.J Biol Chem. 2001 Jun 29;276(26):23492-8. doi: 10.1074/jbc.M102494200. Epub 2001 Apr 19. J Biol Chem. 2001. PMID: 11313362
-
Characterization of the interaction between estrogen metabolites and taurocholate for uptake into isolated hepatocytes. Lack of correlation between cholestasis and inhibition of taurocholate uptake.J Steroid Biochem. 1984 May;20(5):1181-5. doi: 10.1016/0022-4731(84)90364-9. J Steroid Biochem. 1984. PMID: 6727367
-
Taking organelles apart, putting them back together and creating new ones: lessons from the endoplasmic reticulum.Prog Histochem Cytochem. 2011 Jun;46(1):1-48. doi: 10.1016/j.proghi.2011.04.001. Epub 2011 May 4. Prog Histochem Cytochem. 2011. PMID: 21536318 Review.
-
Rough sheets and smooth tubules.Cell. 2006 Aug 11;126(3):435-9. doi: 10.1016/j.cell.2006.07.019. Cell. 2006. PMID: 16901774 Review.
Cited by
-
Impact of low-intensity pulsed ultrasound on transcription and metabolite compositions in proliferation and functionalization of human adipose-derived mesenchymal stromal cells.Sci Rep. 2020 Aug 13;10(1):13690. doi: 10.1038/s41598-020-69430-z. Sci Rep. 2020. PMID: 32792566 Free PMC article.
-
In Vitro Evaluation of the Potential Interactions of Zearalenone-14-sulfate and Zearalenone-14-glucuronide with Human Cytochrome P450 Enzymes, Organic Anion Transporting Polypeptides, and ATP-Binding Cassette Multidrug Transporters.ACS Omega. 2025 Jul 16;10(29):32466-32475. doi: 10.1021/acsomega.5c05217. eCollection 2025 Jul 29. ACS Omega. 2025. PMID: 40757271 Free PMC article.
-
Proteomic Analysis of the Rat Canalicular Membrane Reveals Expression of a Complex System of P4-ATPases in Liver.PLoS One. 2016 Jun 27;11(6):e0158033. doi: 10.1371/journal.pone.0158033. eCollection 2016. PLoS One. 2016. PMID: 27347675 Free PMC article.
-
Molecular Mechanism of Taurocholate Transport by the Bile Salt Export Pump, an ABC Transporter Associated with Intrahepatic Cholestasis.Mol Pharmacol. 2017 Oct;92(4):401-413. doi: 10.1124/mol.117.108688. Epub 2017 Aug 7. Mol Pharmacol. 2017. PMID: 28784620 Free PMC article.
-
Analysis of the Bile Salt Export Pump (ABCB11) Interactome Employing Complementary Approaches.PLoS One. 2016 Jul 29;11(7):e0159778. doi: 10.1371/journal.pone.0159778. eCollection 2016. PLoS One. 2016. PMID: 27472061 Free PMC article.
References
-
- Vavricka S.R., Van Montfoort J., Ha H.R., Meier P.J., Fattinger K. Interactions of rifamycin SV and rifampicin with organic anion uptake systems of human liver. Hepatology. 2002;36:164–172. - PubMed
-
- Zamek-Gliszczynski M.J., Hoffmaster K.A., Nezasa K., Tallman M.N., Brouwer K.L. Integration of hepatic drug transporters and phase II metabolizing enzymes: mechanisms of hepatic excretion of sulfate, glucuronide, and glutathione metabolites. Eur J Pharm Sci. 2006;27:447–486. - PubMed
-
- Rowland A., Miners J.O., Mackenzie P.I. The UDP-glucuronosyltransferases: their role in drug metabolism and detoxification. Int J Biochem Cell Biol. 2013;45:1121–1132. - PubMed
-
- Zollner G., Trauner M. Molecular mechanisms of cholestasis. Wien Med Wochenschr. 2006;156:380–385. - PubMed
Publication types
MeSH terms
Substances
Grants and funding
LinkOut - more resources
Full Text Sources
Other Literature Sources
