. 2014 Jan 28;111(4):1545-50.
doi: 10.1073/pnas.1315153111. Epub 2014 Jan 9.

Osteal macrophages support physiologic skeletal remodeling and anabolic actions of parathyroid hormone in bone

Affiliations

Osteal macrophages support physiologic skeletal remodeling and anabolic actions of parathyroid hormone in bone

Sun Wook Cho et al. Proc Natl Acad Sci U S A. .

Abstract

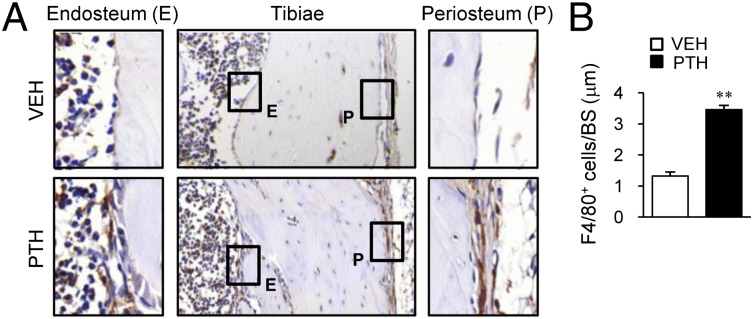
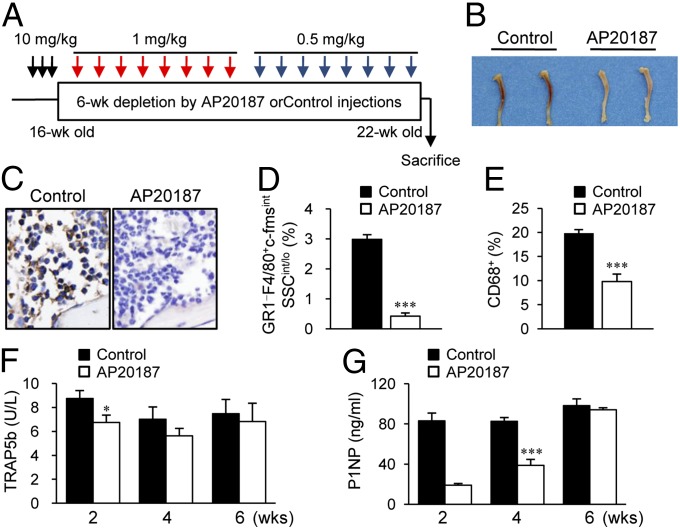
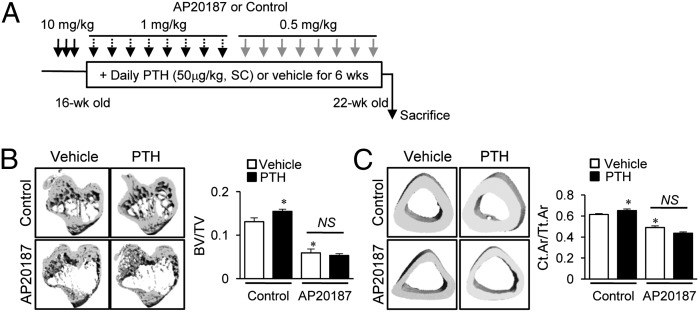
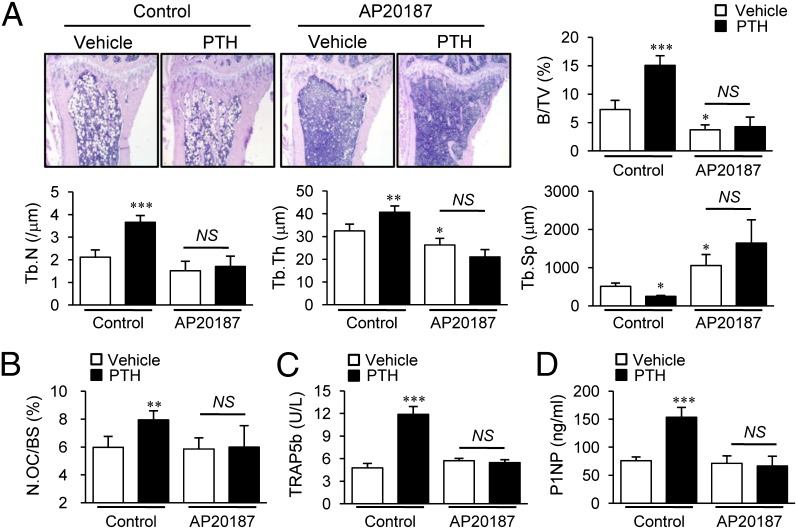
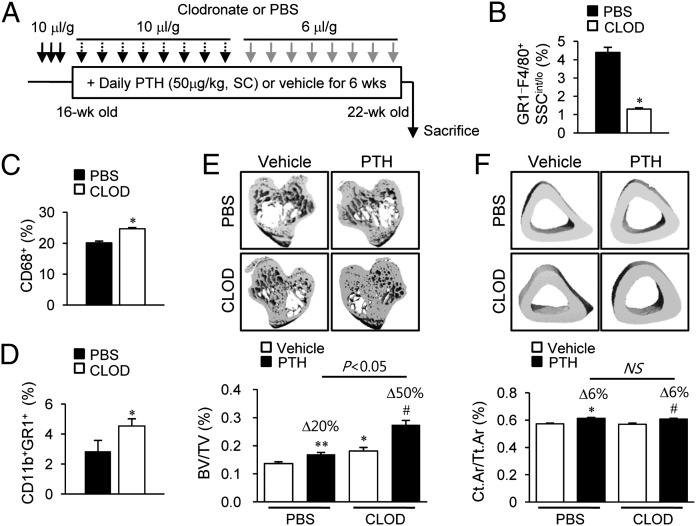
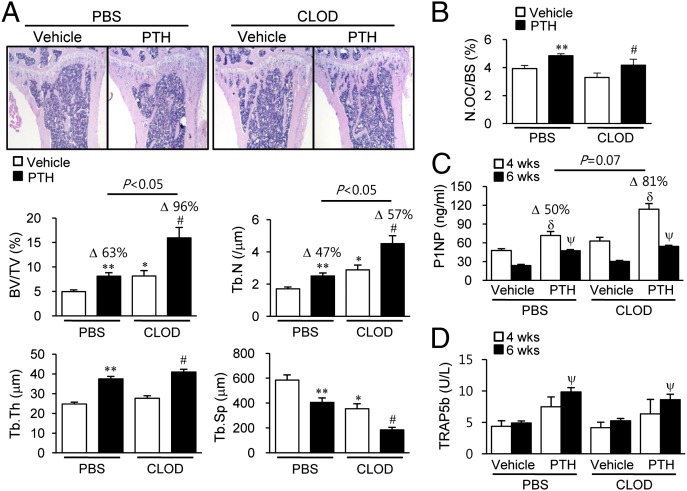
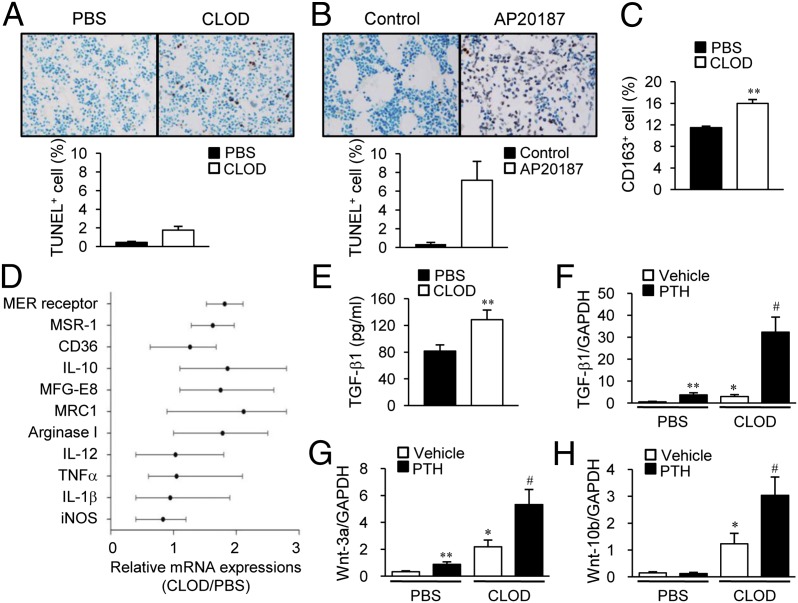
Cellular subpopulations in the bone marrow play distinct and unexplored functions in skeletal homeostasis. This study delineated a unique role of osteal macrophages in bone and parathyroid hormone (PTH)-dependent bone anabolism using murine models of targeted myeloid-lineage cell ablation. Depletion of c-fms(+) myeloid lineage cells [via administration of AP20187 in the macrophage Fas-induced apoptosis (MAFIA) mouse model] reduced cortical and trabecular bone mass and attenuated PTH-induced trabecular bone anabolism, supporting the positive function of macrophages in bone homeostasis. Interestingly, using a clodronate liposome model with targeted depletion of mature phagocytic macrophages an opposite effect was found with increased trabecular bone mass and increased PTH-induced anabolism. Apoptotic cells were more numerous in MAFIA versus clodronate-treated mice and flow cytometric analyses of myeloid lineage cells in the bone marrow showed that MAFIA mice had reduced CD68(+) cells, whereas clodronate liposome-treated mice had increased CD68(+) and CD163(+) cells. Clodronate liposomes increased efferocytosis (clearance of apoptotic cells) and gene expression associated with alternatively activated M2 macrophages as well as expression of genes associated with bone formation including Wnt3a, Wnt10b, and Tgfb1. Taken together, depletion of early lineage macrophages resulted in osteopenia with blunted effects of PTH anabolic actions, whereas depletion of differentiated macrophages promoted apoptotic cell clearance and transformed the bone marrow to an osteogenic environment with enhanced PTH anabolism. These data highlight a unique function for osteal macrophages in skeletal homeostasis.


Conflict of interest statement

The authors declare no conflict of interest.

Figures

Fig. 1.
Fig. 1.
Osteal macrophages in PTH actions in bone. Mice (16 wk old, female) were treated with intermittent PTH (50 µg/kg) or saline for 4 wk. Tibiae were stained for mouse F4/80. (A) Representative images are shown. (Insets) Enlarged views of F4/80+ cells (brown stain) in endosteal (E) and periosteal (P) areas. (B) Numbers of F4/80+ cells per bone surface in endosteal regions. n = 6 per group. **P < 0.01 versus vehicle.
Fig. 2.
Fig. 2.
Long-term depletion of myeloid cells in MAFIA mice. (A) Macrophage depletion regimen. MAFIA mice (16 wk old, female) were treated with three consecutive AP20187 (10 mg/kg) injections (black arrows), followed by booster injections every third day (1 mg/kg for 3 wk, then 0.5 mg/kg for 3 wk; red and blue arrows, respectively). (B) Photographic representation and (C) F4/80+ immunohistochemical staining of tibiae harvested after 6-wk AP20187 or control treatments. Flow cytometric quantification of (D) GR1F4/80+c-fmsintSSCint/lo and (E) CD68+ cells. Serum samples were collected at 2-, 4-, and 6-wk time points during the 6-wk AP20187 treatment period. (F) TRAP5b (units per liter) and (G) P1NP (nanograms per milliliter) were measured. Data are mean ± SEM of two independent experiments. n = 6–10 per group. *P < 0.01; ***P < 0.001 versus control.
Fig. 3.
Fig. 3.
μCT analyses of bone in long-term depleted MAFIA mice. (A) Treatment regimen with PTH and AP20187. MAFIA mice (16 wk old, female) were treated with three consecutive AP20187 (10 mg/kg) injections, followed by booster injections every third day (1 mg/kg for 3 wk, then 0.5 mg/kg for 3 wk). Six weeks of intermittent PTH (50 μg/kg) were started after the initial 3 d. Representative images and quantitative analyses of μCT scanning of tibiae for (B) trabecular bone volumes and (C) fractional cortical bone areas. All data are means ± SEM of two independent experiments. n = 8–10 per group. NS, not significant; *P < 0.05 versus vehicle-treated control.
Fig. 4.
Fig. 4.
Bone histomorphometric and serum analyses in long-term depleted MAFIA mice. Histomorphometric analyses of tibiae using the experimental design in Fig. 3A. (A) Histologic images and static morphometric parameters, including bone volume (BV/TV), trabecular number (Tb.N), trabecular thickness (Tb.Th), and trabecular spacing (Tb.Sp). (B) TRAP+ osteoclast numbers (N.OC/BS) were determined. Serum (C) TRAP5b (units per liter) and (D) P1NP (nanograms per milliliter) levels determined at 6 wk. Data are mean SEM of two independent experiments. n = 8–10 per group. NS, not significant; *P < 0.05; **P < 0.01; ***P < 0.001 versus vehicle-treated control (the left-most column of each graph).
Fig. 5.
Fig. 5.
Bone marrow FACs and μCT analyses in clodronate liposome-treated mice. (A) Treatment regimen with clodronate liposomes and PTH. Mice (16 wk old, female) were treated with three consecutive injections of clodronate liposomes (10 μL/g), followed by booster injections every third day (10 μL/g for 3 wk, then 6 μL/g for 3 wk). Six weeks of intermittent PTH (50 μg/kg) were started 3 d after the initiation of clodronate treatment. (BD) Flow cytometric analyses of the whole bone marrow cells. Quantitative analyses of (B) GR1F4/80+SSCint/lo cells, (C) CD68+ cells, and (D) CD11b+GR1+ cells. Representative images and graphs (below) of μCT analyses of (E) trabecular bone volumes and (F) fractional cortical bone areas. Data are mean ± SEM of two independent experiments. n = 10–15 per group. CLOD, clodronate liposome; NS, not significant; PBS, PBS liposome. *P < 0.05; **P < 0.01 versus vehicle-treated PBS; #P < 0.05 versus vehicle-treated CLOD.
Fig. 6.
Fig. 6.
Bone histomorphometric and serum analyses in clodronate liposome-treated mice. Histomorphometric analyses of tibiae using the experimental design in Fig. 5A. (A) Representative images with histomorphometric analyses. (B) Osteoclast numbers per bone volume (N.OC/BS) measured in TRAP-stained sections. *P < 0.05; **P < 0.01 versus vehicle-treated PBS. (C and D) Serum (C) P1NP (nanograms per milliliter) and (D) TRAP5b (units per liter) measured at 4 and 6 wk. #P < 0.05 versus vehicle-treated CLOD; δP < 0.05 versus vehicle in each group at 4 wk; ψP < 0.05 versus vehicle in each group at 6 wk. Data are mean ± SEM of two independent experiments. n = 10–15 per group. CLOD, clodronate liposome; PBS, PBS liposome.
Fig. 7.
Fig. 7.
Bone microenvironment changes in macrophage-depleted mice. (A) TUNEL staining on tibial sections in mice (16 wk old, female) treated with clodronate liposomes following the regimen in Fig 5A. (B) TUNEL staining on tibial sections in mice (16 wk old, female) treated with the regimen in Fig 2A. TUNEL+ cells were enumerated. n = 7 per group. (CE) Mice (16 wk old, female) were treated with clodronate liposomes; three consecutive injections were followed by booster injections (every third day, 10 μL/g for 3 wk and 6 μL/g for 1 wk). (C) Flow cytometric analysis of whole marrow cells using anti-CD163 antibody. (D) Genes related to M1/M2 macrophage were analyzed by real-time PCR from whole marrow mRNA. (E) Protein levels of TGF-β1 in bone marrow. **P < 0.01 versus vehicle. (FH) Mice (16 wk old, female) were treated with clodronate liposomes; three consecutive injections were followed by booster injections (every third day, 10 μL/g for 3 wk and 6 μL/g for 1 wk). Four weeks of intermittent PTH (50 μg/kg) were started after the initial 3 d. Whole marrow mRNA was analyzed by real-time PCR using specific primers for (F) Tgfb1, (G) Wnt3a, and (H) Wnt10b. *P < 0.05; **P < 0.01 versus vehicle-treated PBS; #P < 0.05 versus vehicle-treated CLOD. Data are mean ± SEM of two independent experiments. n = 6 per group. CLOD, clodronate liposome; PBS, PBS liposome.

References

    1. Wu JY, et al. Osteoblastic regulation of B lymphopoiesis is mediated by Gsalpha-dependent signaling pathways. Proc Natl Acad Sci USA. 2008;105(44):16976–16981. - PMC - PubMed
    1. Calvi LM, et al. Osteoblastic cells regulate the haematopoietic stem cell niche. Nature. 2003;425(6960):841–846. - PubMed
    1. Weber JM, et al. Parathyroid hormone stimulates expression of the Notch ligand Jagged1 in osteoblastic cells. Bone. 2006;39(3):485–493. - PubMed
    1. Cho SW, et al. The soluble interleukin-6 receptor is a mediator of hematopoietic and skeletal actions of parathyroid hormone. J Biol Chem. 2013;288(10):6814–6825. - PMC - PubMed
    1. Zhu J, et al. Osteoblasts support B-lymphocyte commitment and differentiation from hematopoietic stem cells. Blood. 2007;109(9):3706–3712. - PubMed

Publication types

LinkOut - more resources