Review
. 2014 Feb 21;14(4):626-45.
doi: 10.1039/c3lc90136j.

Rare cell isolation and analysis in microfluidics

Affiliations
Review

Rare cell isolation and analysis in microfluidics

Yuchao Chen et al. Lab Chip. .

Abstract

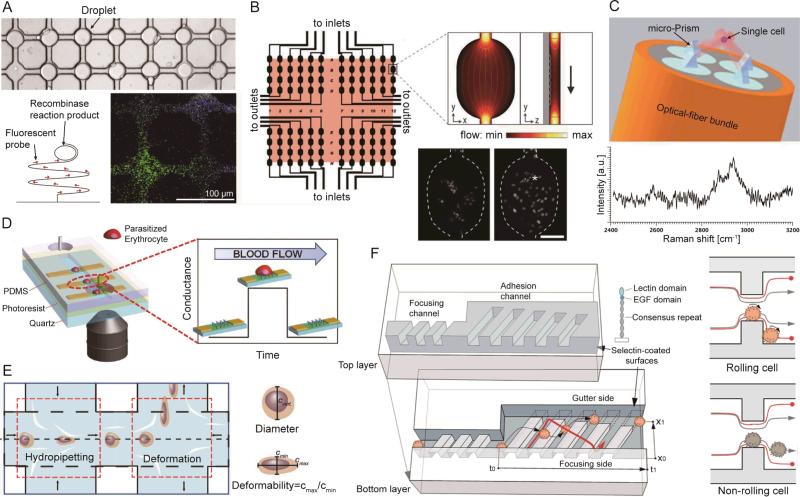
Rare cells are low-abundance cells in a much larger population of background cells. Conventional benchtop techniques have limited capabilities to isolate and analyze rare cells because of their generally low selectivity and significant sample loss. Recent rapid advances in microfluidics have been providing robust solutions to the challenges in the isolation and analysis of rare cells. In addition to the apparent performance enhancements resulting in higher efficiencies and sensitivity levels, microfluidics provides other advanced features such as simpler handling of small sample volumes and multiplexing capabilities for high-throughput processing. All of these advantages make microfluidics an excellent platform to deal with the transport, isolation, and analysis of rare cells. Various cellular biomarkers, including physical properties, dielectric properties, as well as immunoaffinities, have been explored for isolating rare cells. In this Focus article, we discuss the design considerations of representative microfluidic devices for rare cell isolation and analysis. Examples from recently published works are discussed to highlight the advantages and limitations of the different techniques. Various applications of these techniques are then introduced. Finally, a perspective on the development trends and promising research directions in this field are proposed.


Figures

Fig. 1
Fig. 1
(A) Filtration using a 3D microfilter device and (inset) the applied forces on a trapped cell. FL: force caused by the fluidic flow pressure. FS: supporting force from the bottom membrane. FT: tensional stress force on the plasma membrane. (B) Microfluidic ratchet cell-sorting mechanism. Smaller and more deformable cells can squeeze through the funnel constrictions during forward flow. However, they are unable to pass back through the funnels when the flow direction is reversed periodically to unclog the filter. (C) A DLD device with one inlet and two outlets (collection and waste). Using a symmetrical design, large cells dispersed in the inlet are focused against the central channel wall, where they can be collected at the collection outlet, while smaller cells enter the waste outlet. (D) A DLD device designed to separate WBCs from RBCs and platelets. 13 sections of post arrays with different critical diameters and spacings were used to separate cells with a range of diameters. (E) Schematic illustration of the separation principle for high-throughput CTC isolation using Dean Flow Fractionation. Under the influence of Dean drag forces (blue arrows), the smaller hematologic cells migrate along the Dean vortices towards the inner wall, then back towards the outer wall again. The larger CTCs will experience additional strong inertial lift forces (red arrows) and focus along the microchannel inner wall, thus achieving separation. (F) The principle of a vortex chip based on inertial forces. At the channel inlet, cells are randomly distributed and experience two opposing lift forces, the wall effect FLW and the shear-gradient lift force FLS. As a result, cells migrate to dynamic lateral equilibrium positions, Xeq. Upon entrance into the reservoir, the wall effect is reduced. Larger cells still experience a large FLS and are pushed away from the channel centerline into the vortices. Smaller cells do not experience enough FLS and remain in the main flow. Images reproduced from Refs. , , , , , and .
Fig. 2
Fig. 2
(A) A continuous-flow chamber based on dielectrophoretic field-flow-fractionation (DEP-FFF) to isolate tumor cells from peripheral blood mononuclear cells (PBMNs). (B) Schematic diagram of a microfluidic device for cancer cell separation using multi-orifice flow fractionation (MOFF) and DEP. In the first separation region, the relatively larger MCF-7 cells and a few blood cells pass into the center channel and enter the DEP channel, while most blood cells exit at Outlet I. In the focusing region, all cells experience a positive DEP force and then align along both sides of the channel. Finally, the second separation region selectively isolates MCF-7 cells via DEP. (C) An illustration of a microfluidic device using an optically induced-dielectrophoretic (ODEP) force for cancer cell isolation. Six sections of animated (moving in the direction of the red arrows) light-bar screens were digitally projected onto the CTC isolation zone. Images reproduced from Refs. , , and .
Fig. 3
Fig. 3
(A) Schematic showing the chemical conjugation between the functionalized graphene oxide nanosheets and the EpCAM antibodies. Graphene oxide nanosheets are adsorbed onto the gold pattern. The N-γ-maleimidobutyryloxy succinimide ester (GMBS) crosslinker binds to PL–PEG–NH2 on the graphene oxide nanosheets. The NeutrAvidin is connected to the GMBS and biotinylated EpCAM. (B) Enhanced cell transport to a fluid-permeable capture surface is achieved by diverging streamlines. Gentle cell rolling and arrest on the capture surface occurs due to reduced shear and increased cell-surface interactions. (C) Isolation and detection of cancer cells in whole blood using a long, multivalent DNA aptamer-based microfluidic device. The magnified box illustrates a captured cell bound by several long DNA molecules via multiple aptamer domains (red colored sections). (D) Schematic of a nanotopography generated by RIE on a glass surface. The inserts show a magnified illustration (right) and SEM (left) images of cancer cells captured on the nanoroughened glass surfaces. Images reproduced from Refs. , , , and .
Fig. 4
Fig. 4
(A) Schematic of a magnetophoretic microdevice with two inlets and two outlets. Inset shows how magnetic beads flowing from the upper source path are pulled across the laminar streamline boundary into the lower collection path when subjected to a magnetic field gradient. (B) Capture principle of a magnetic sifter. A whole blood sample is labeled with magnetic tags and pumped through the pores by an applied external magnetic field. Magnetically labeled target cells are captured at the pore edges where high magnetic field gradients exist. Unlabeled cells pass through the pores. (C) Operating principle and practical implementation of the Ephesia system. A hexagonal array of magnetic ink is patterned on the bottom of a microfluidic channel. The application of an external vertically-aligned magnetic field induces the formation of a regular array of magnetic bead columns localized on top of the ink dots. After the passage of 400 Raji cells, numerous cells are captured on the columns. Images reproduced from Refs. , , and .
Fig. 5
Fig. 5
(A) A microdevice for rolling-circle-enhanced enzyme activity detection (REEAD) assay for the specific detection of single enzymatic events. The droplets are confined in a drop-trap on a primer-coated glass slide on which isothermal rolling circle amplification (RCA) takes place. (B) Schematic of the microarray layout with 96 wells with the 6 × 5 mm2 scanning area shaded. Inset shows a finite element model of fluid flow through a microwell. The fluorescence images show the H2B-EYFP-labeled PtK2 cells in a single microwell after seeding (left); 12 h later (right), they attached, spread, and divided (*). Scale bar: 100 μm. (C) Schematic of optical trapping of a single cell for Raman spectroscopy. (D) (Left) A microdevice for graphene-based detection of single Plasmodium falciparum-infected erythrocyte. (Right) Specific binding between ligands located on positively charged membrane knobs of infected erythrocyte and CD36 receptors on the graphene channel produces a distinct conductance change. The conductance returns to a baseline value when the parasite-infected erythrocyte exits the graphene channel. (E) A microdevice for hydrodynamic deformability cytometry. The first opposing pair of microchannel branched flows impact the cell suspension perpendicularly to perform hydropipetting. The second pair of channels flows towards the cell suspension, forming an extensional flow to perform deformability cytometry. (F) (Left) Schematic of the microfluidic cell rolling cytometer, in which cells are forced into contact with adhesion molecule-coated ridges. (Right) Cross-section views of the cell rolling cytometer. Specific adhesion interactions retard the cell and change its trajectory. Without specific interactions, a cell quickly travels through the channel, following the focusing trajectory. Images reproduced from Refs. , , , , , and .

References

    1. Dharmasiri U, Witek MA, Adams AA, Soper SA. Annu. Rev. Anal. Chem. 2010;3:409–431. - PubMed
    1. Pratt ED, Huang C, Hawkins BG, Gleghorn JP, Kirby BJ. Chem. Eng. Sci. 2011;66:1508–1522. - PMC - PubMed
    1. Gossett DR, Weaver WM, Mach AJ, Hur SC, Tse HTK, Lee W, Amini H, Di Carlo D. Anal. Bioanal. Chem. 2010;397:3249–3267. - PMC - PubMed
    1. Harouaka RA, Nisic M, Zheng SY. J. Lab. Autom. 2013 DOI: 10.1177/2211068213494391. - PMC - PubMed
    1. Jin C, McFaul SM, Duffy SP, Deng X, Tavassoli P, Black PC, Ma H. Lab Chip. 2013;14:32–44. - PubMed

Publication types

MeSH terms