

Prevalence and nature of early glaucomatous defects in the central 10° of the visual field
- PMID: 24407153
- PMCID: PMC4204644
- DOI: 10.1001/jamaophthalmol.2013.7656
Prevalence and nature of early glaucomatous defects in the central 10° of the visual field
Abstract
Importance: The macula is essential for visual functioning and is known to be affected even in early glaucoma. However, little is currently understood about the prevalence and nature of central vision loss in early glaucoma.
Objective: To determine the prevalence and characteristics of visual field (VF) defects in the central 10° in glaucoma suspects and patients with mild glaucoma using a prospective design.
Design, setting, and participants: This prospective observational cohort study was conducted at an outpatient glaucoma specialty clinic. One hundred eyes from 74 patients with glaucomatous optic neuropathy and a 24-2 VF with mean deviation better than -6 dB were prospectively studied and tested with a 10-2 test.
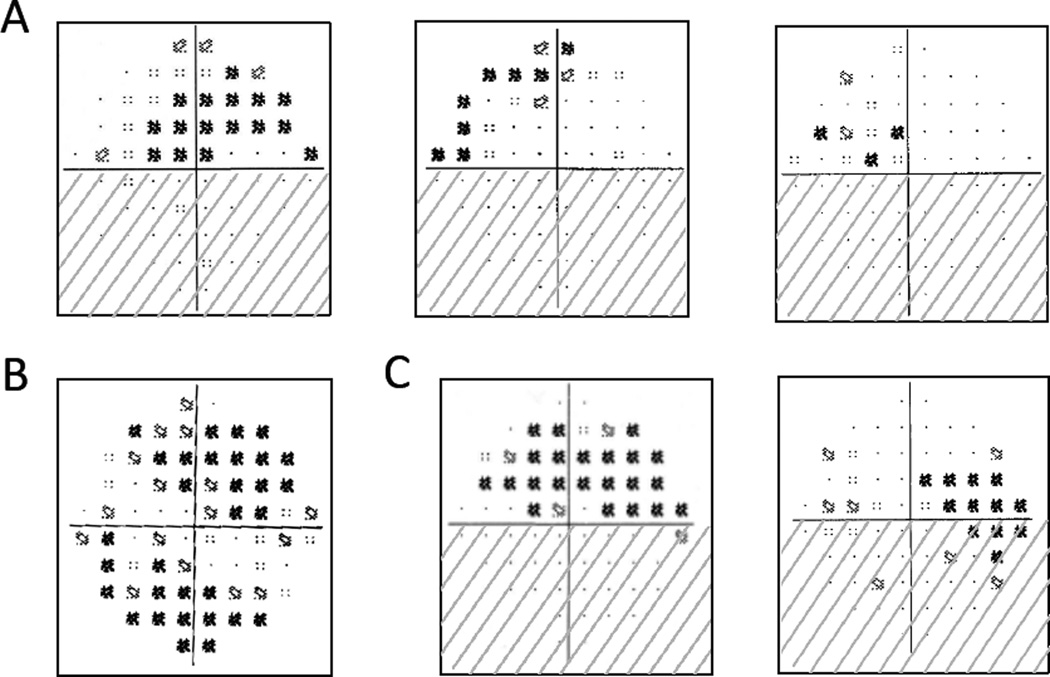
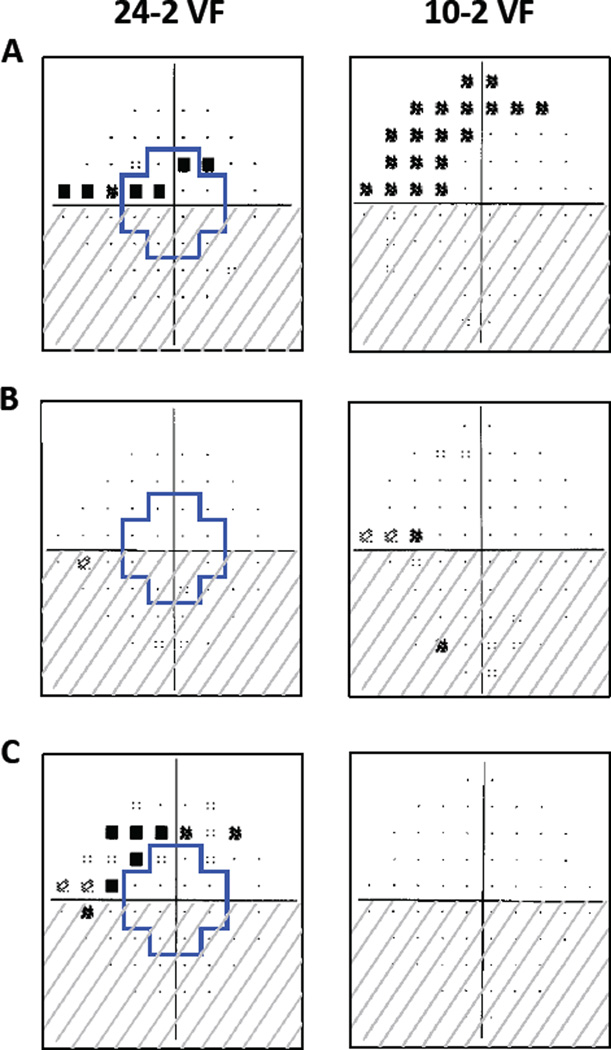
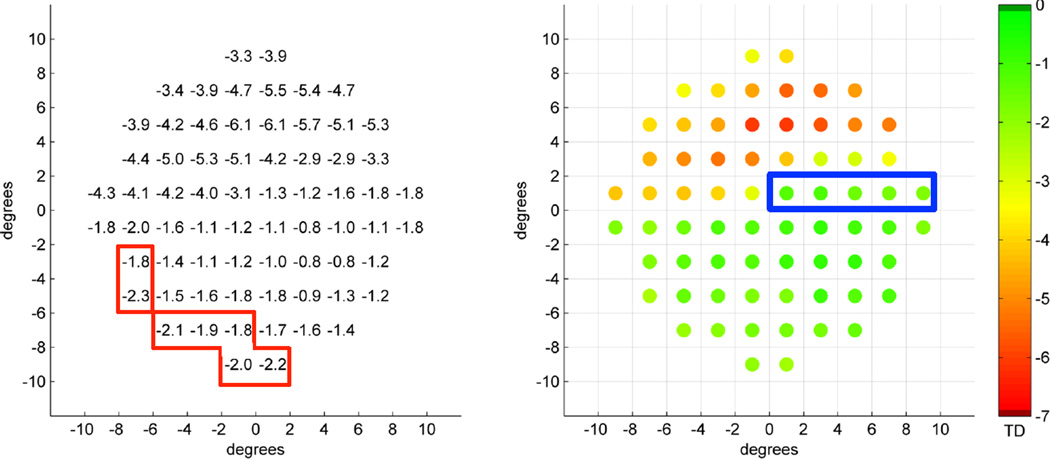
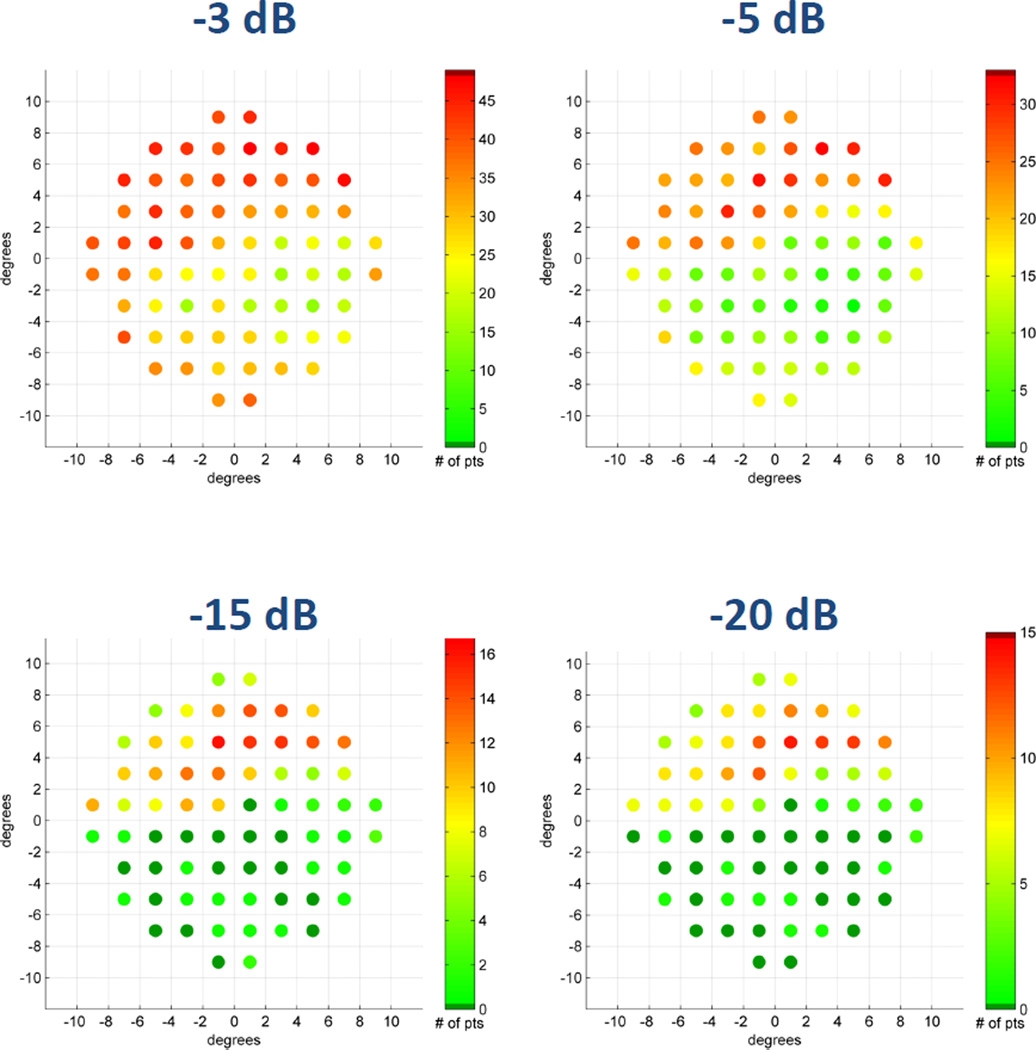
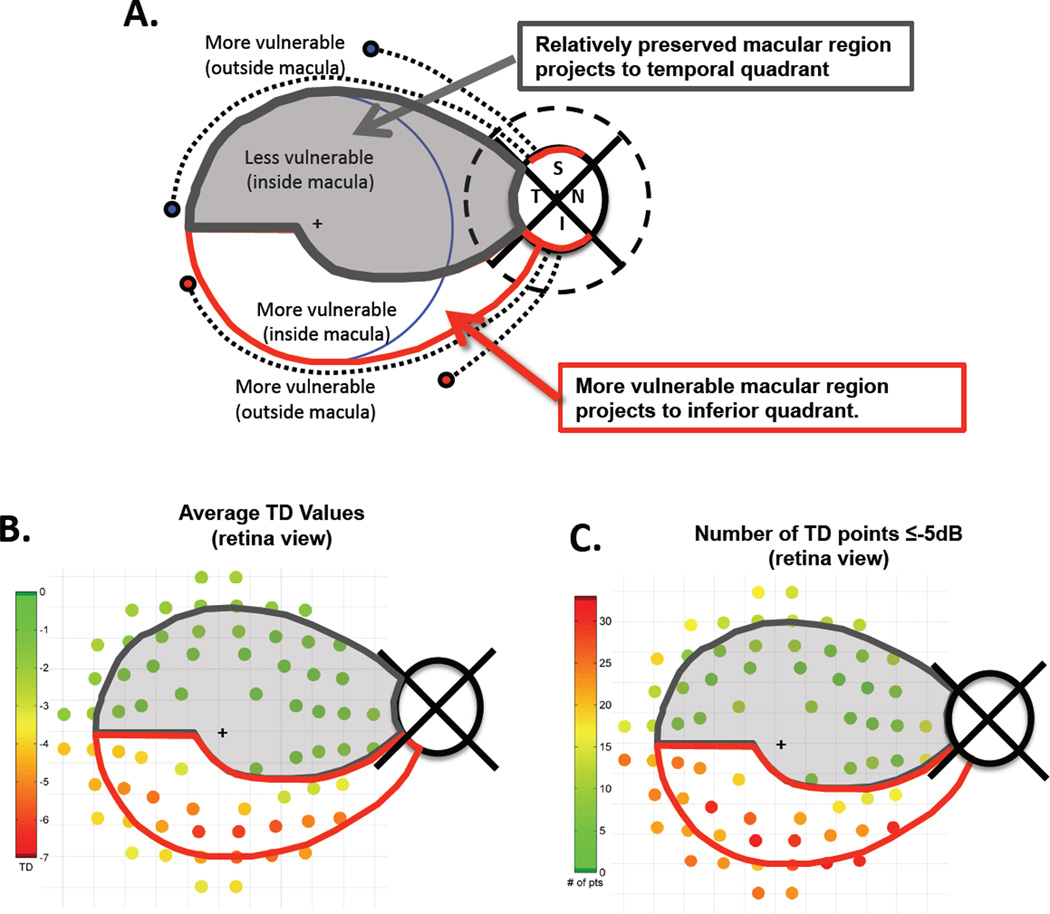
Main outcomes and measures: Reliable: VF hemifields were classified as abnormal based on a cluster criterion, and abnormal 10-2 VFs were categorized based on the pattern of abnormal points: arcuatelike, widespread, or other. In addition, at each point of the 10-2 VF, the total deviation values were averaged across eyes and the number of abnormal points with total deviation values below a specific criterion level were calculated. RESULTS There appeared to be as many abnormal 10-2 hemifields (53%) as abnormal 24-2 hemifields (59%). Of the eyes with normal 24-2 hemifields, 16% were classified as abnormal when the 10-2 test was used. Of the abnormal 10-2 hemifields, 68%, 8%, and 25% were arcuatelike, widespread, and other, respectively. The average total deviation values and number of abnormal points plots revealed superior VF defects that were deeper and closer to fixation than those in the inferior VF.
Conclusions and relevance: The 10-2 VF was abnormal in nearly as many hemifields as was the 24-2 VF, including some with normal 24-2 VF, suggesting that the 24-2 test is not optimal for detecting early damage of the macula. The pattern of the defects was in agreement with a recent model of macular damage.
Conflict of interest statement
I. Traynis: None, C.G. De Moraes: None, A.S. Raza: None, J.M. Liebmann: None, R. Ritch: None, D.C. Hood: None.
Figures
References
-
- Curcio CA, Allen KA. Topography of ganglion cells in human retina. J Comp Neurol. 1990;300(1):5–25. - PubMed
-
- Aulhorn E, Harms M. In: Early visual field defects in glaucoma. Leydhecker W, editor. Basel:Karger: Glaucoma, Tutzing Symposium; 1967. pp. 151–186.
-
- Drance SM. The early field defects in glaucoma. Invest Ophthalmol. 1969;8(1):84–91. - PubMed
Publication types
MeSH terms
Grants and funding
LinkOut - more resources
Full Text Sources
Other Literature Sources
Medical
Miscellaneous
