. 2014 Apr:64:131-141.
doi: 10.1016/j.nbd.2013.12.013. Epub 2014 Jan 7.

A novel GABRG2 mutation, p.R136*, in a family with GEFS+ and extended phenotypes

Affiliations

A novel GABRG2 mutation, p.R136*, in a family with GEFS+ and extended phenotypes

Ann J Johnston et al. Neurobiol Dis. 2014 Apr.

Abstract

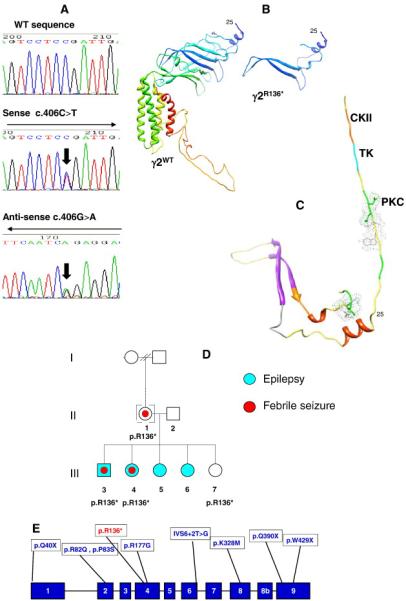
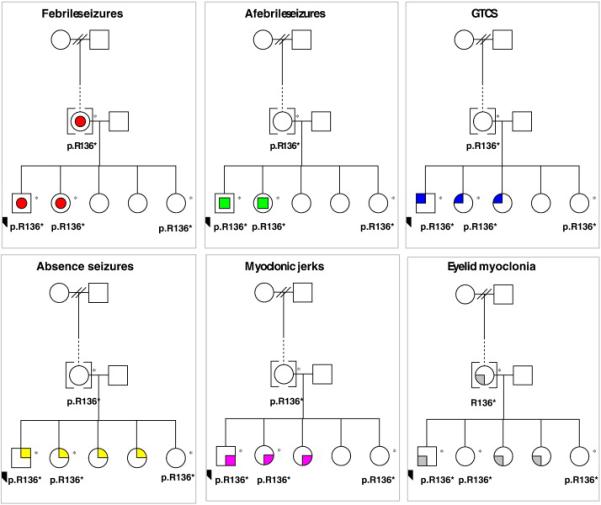
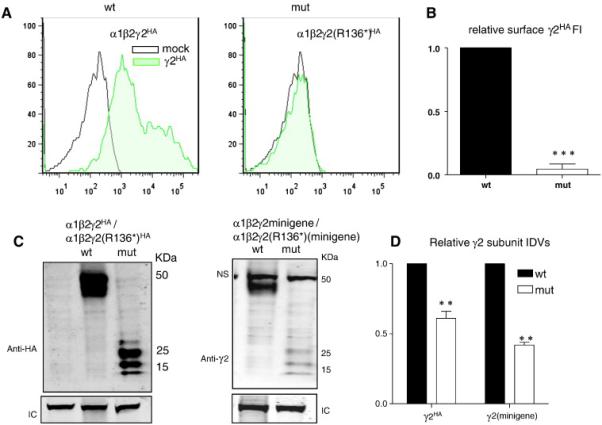
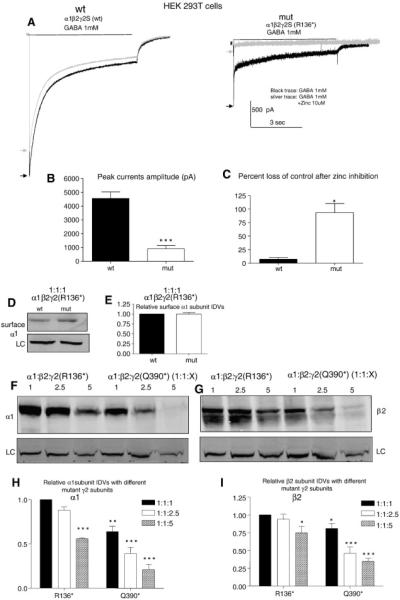
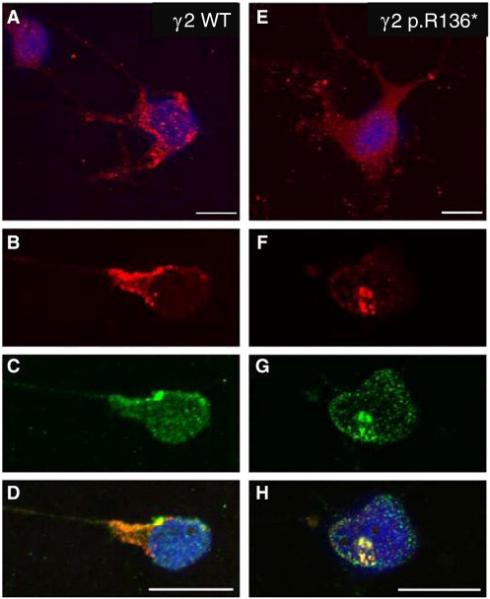
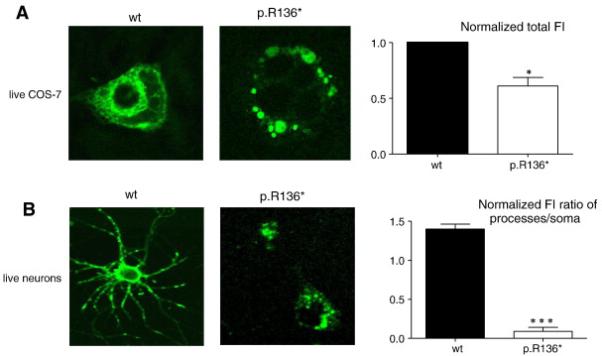
Genetic mutations in voltage-gated and ligand-gated ion channel genes have been identified in a small number of Mendelian families with genetic generalised epilepsies (GGEs). They are commonly associated with febrile seizures (FS), childhood absence epilepsy (CAE) and particularly with generalised or genetic epilepsy with febrile seizures plus (GEFS+). In clinical practice, despite efforts to categorise epilepsy and epilepsy families into syndromic diagnoses, many generalised epilepsies remain unclassified with a presumed genetic basis. During the systematic collection of epilepsy families, we assembled a cohort of families with evidence of GEFS+ and screened for variations in the γ2 subunit of the γ-aminobutyric acid (GABA) type A receptor gene (GABRG2). We detected a novel GABRG2(p.R136*) premature translation termination codon in one index-case from a two-generation nuclear family, presenting with an unclassified GGE, a borderline GEFS+ phenotype with learning difficulties and extended behavioural presentation. The GABRG2(p.R136*) mutation segregates with the febrile seizure component of this family's GGE and is absent in 190 healthy control samples. In vitro expression assays demonstrated that γ2(p.R136*) subunits were produced, but had reduced cell-surface and total expression. When γ2(p.R136*) subunits were co-expressed with α1 and β2 subunits in HEK 293T cells, GABA-evoked currents were reduced. Furthermore, γ2(p.R136*) subunits were highly-expressed in intracellular aggregations surrounding the nucleus and endoplasmic reticulum (ER), suggesting compromised receptor trafficking. A novel GABRG2(p.R136*) mutation extends the spectrum of GABRG2 mutations identified in GEFS+ and GGE phenotypes, causes GABAA receptor dysfunction, and represents a putative epilepsy mechanism.

Keywords: Epilepsy; GABAA receptors; Protein truncating mutations; Receptor trafficking.


Figures

Figure 1
Figure 1. A novel GABRG2 gene-mutation
A) Sequencing of exon 4 of GABRG2 in a control (a) and affected index -case DNA (b+c) reveals a new GABRG2 gene-mutant (c.406C>T) resulting in a nonsense mutation outcome - GABRG2(p.R136*). This is illustrated by the double nucleotide peak and marked with an arrow; B) Structural modelling of γ2 WT illustrating the position of R136 and posttranslational modification sites of the truncated GABRG2(p.R136*) subunit. Residues 1-25 could not be reliably modelled due to a lack of coverage for this section by homologues in the Protein Data Bank. The truncated GABRG2(p.R136*) subunit section composes several sections of beta turn, two short regions of alpha helix, retention of functional domains, and two beta strands. C) Structural modelling of γ2 WT illustrating the posttranslational modification sites of the truncated GABRG2(p.R136*). CKII = casein kinase II phosphorylation (orange); TK = tyrosine kinase phosphorylation (cyan); PKC = protein kinase C phosphorylation (green); and the side chains for N-glycosylation and N-myristoylation are shown. D) Pedigree structure and outcomes of GABRG2 sequencing. A pedigree of the nuclear GEFS+ family harbouring the novel GABRG2(p.R136*) mutation and the affection status for epilepsy (cyan) or febrile seizures (red dot) indicated. E) Spectrum of known mutations in GABRG2 relative to the novel GABRG2(p.R136*) mutation. An exonic representation of the GABRG2 gene illustrates the relative positions of the GABRG2(p.R136*) mutation to previously-identified GABRG2 mutations.11-21
Figure 2
Figure 2. Endophenotyping of the GEFS+ Family and the segregation with the GABRG2 p.R136* mutation
Each presenting phenotype within the multiplex family is represented in a panel, including febrile seizures (red circles), afebrile seizures (green squares), generalised tonic-clonic seizures (GTCS – blue quarter), absence seizures (yellow quarter), myclonic jerks (magenta quarters), and eyelid myoclonia (grey quarters).
Figure 3
Figure 3. The mutant γ2S(p.R136*) subunit protein was produced and presented as multiple bands but had minimal surface expression
HEK 293T cells were co-transfected with α1 and β2 subunits and γ2SHA(wt) or γ2S(p.R136*)HA (mut) subunits or co-transfected with α1 and β2 subunits and γ2 (wt) or γ2(p.R136*) (mut) minigenes. A) The flow cytometry histograms depict surface expression levels of wild-type γ2SHA or mutant γ2S(p.R136*)HA subunits from HEK 293T cells expressing either α1, β2 and γ2SHA or α1, β2 and γ2S(p.R136*)HA subunits. The surface wild-type and mutant γ2S subunits were fluorescently conjugated with anti-human HA antibody (HA–Alexa Fluor-647). B) The relative fluorescence intensity of HA signals of from mutant γ2S(p.R136*)HA subunits were normalized to those obtained with wild-type γ2SHA subunits. C, D) The total lysates of HEK 293T cells expressing α1, β2 and γ2SHA subunits from expression of cDNAs (C, left panel) or minigenes (C, right panel) were analyzed by SDS-PAGE. LC stands for loading control. NS stands for nonspecific band. D) The total IDVs of γ2SHA subunit cDNA or minigene transfections were quantified, and the data were presented after normalized to the total wild-type γ2HA or γ2 subunits obtained with expression of minigenes (In B and D, **p < 0.001 ***p < 0.001 vs wt).
Figure 4
Figure 4. Current amplitudes recorded with co-expression of α1 and β2 subunits with mutant γ2S(p.R136*) subunits had reduced peak current amplitudes and were more sensitive to zinc inhibition while the muant γ2S(p.R136*) subunits reduced the α1 and β2 subunit expression at high amounts
A,B) GABAA receptor currents were obtained from HEK 293T cells expressing wild-type α1 and β2 subunits with γ2S (1:1:1 cDNA ratio; wt) or γ2S(p.R136*) (1:1:1 cDNA ratio, mut) subunits with application of 1 mM GABA applied for 6 sec. The representative traces of GABAA receptor currents were evoked with application of 1 mM GABA for 6 sec (black trace, black arrow) and co-application of 1mM GABA with 10 μM zinc after 6 sec pre-application of 10 μM zinc (silver traces, silver arrow). (B) The amplitudes of GABAA receptor currents from (A) were plotted. Values were mean ± SEM (n = 9-14 patches from 4 different transfections). C) The percent loss of control current or reduction of current amplitude after coapplication of zinc and GABA was presented by the currents evoked by GABA subtracting the currents evoked by GABA and zinc (*p<0.05***p < 0.001 vs wt, n= 4). D,E). The surface α1 subunit was extracted from HEK 293T cells expressing wild-type α1 and β2 subunits with γ2S (1:1:1 cDNA ratio; wt) or γ2S(p.R136*) (1:1:1 cDNA ratio, mut) subunits by surface biotinylation and analyzed by SDS-PAGE. The membranes were immunoblotted with a mouse anti- α1 antibody. (E). The relative amount of the α1 subunit expression in the mutant α1β2γ2S(p.R136*) receptors was normalized to the wildtype, which is arbitrarily taken as 1. F, G, H, I). The total lysates from HEK 293T cells expressing wild-type α1 and β2 subunits with γ2S(p.136*) or γ2S(p.Q390X) at 1:1:1, 1:1:2.5 and 1:1:5 cDNA ratio were harvested and analysed by SDS-PAGE. The membranes were then immunoblotted with either mouse anti-α1 or rabbit anti β2 antibody. The relative amount of the α1 or β2 subunit expression in other conditions were normalized to the α1β2γ2S(p.R136*) receptors at 1:1:1 which was arbitrarily taken as 1 ( in H and I,*p<0.05; **p < 0.01 ;***p < 0.001 vs α1β2γ2S(p.R136*) at 1:1:1, n= 4).
Figure 5
Figure 5. Expression analysis of γ2(p.R136*) in vitro using differentiated PC12 cells
GABAA receptor subunits α1, β2 and γ2-WT (A-D) or γ2 p.R136* mutant (E-H) subunits were transiently co-transfected in PC12 cells, and immunocytochemically stained with anti-γ2 and anti-β2,3-antibodies as analysed by confocal microscopy. α1β2γ2 receptor immunoreactivity (IR) revealed an even distribution with punctuate staining on cell-surface, less prominent intra-cellular staining (A, B) and co-localized with GABAAR β2-IR (C, D). Expression of α1β2γ2(p.R136*) receptors resulted in more diffuse labelling with little cell-surface IR (E) and was predominantly localised within intracellular domains (F), whilst retaining co-labelling patterns for GABAAR β2-IR (G, H). Scale bars = 20 μm.
Figure 6
Figure 6. γ2S(p.R136*)YFP subunit protein was reduced and confined to intracellular region or soma in live COS-7 cells and cortical neurons
COS-7 cells or cultured cortical neurons were cotransfected with wild-type γ2SYFP (wt) or mutant γ2S(p.R136*)YFP (mut) subunits with (in COS-7 cells) or without (in neurons) α1 and β2 subunits using the calcium phosphate precipitation method with different amounts of subunit cDNAs. Images were acquired 2 days (COS-7) or 8 days (neurons) after transfection. The total fluorescence intensities of cells were measured using the MetaMorph imaging software. In the upper panel, the total fluorescence from COS-7 cells expressing wild-type γ2SYFP subunit-containing receptors (wt) was arbitrarily taken as 1, and the total fluorescence from cells expressing mutant γ2S(p.R136*)YFP subunit-containing receptors (mut) was normalized to wt levels. In lower panel, the total fluorescence of both neuronal somata and processes (including both axon and dendrites) were measured, and the fluorescence intensity ratios of the areas of processes over the somata were quantified. (n = 8 for COS-7 and for neurons from three different transfections; *p < 0.05; ***p < 0.001 vs wt).

References

    1. Altschul SF, Gish W, Miller W, Myers EW, Lipman DJ. Basic local alignment search tool. J. Mol. Biol. 1990;215:403–410. - PubMed
    1. Angelotti TP, Uhler MD, Macdonald RL. Assembly of GABAA receptor subunits: Analysis of transient single cell expression utilizing a fluorescent substrate/marker gene combination. J. Neurosci. 1993a;13:1418–1428. - PMC - PubMed
    1. Angelotti TP, Macdonald RL. Assembly of GABAA receptor subunits: α1β1 and α1β1γ2S subunits produce unique ion channels with dissimilar single-channel properties. J Neurosci. 1993b;13:1429–1440. - PMC - PubMed
    1. Audenaert D, Schwartz E, Claeys KG, Claes L, Deprez L, Suls A, et al. A novel GABRG2 mutation associated with febrile seizures. Neurology. 2006;67:687–690. - PubMed
    1. Baulac S, Huberfeld G, Gourfinkel-An I, Mitropoulou G, Beranger A, Prud'homme JF, et al. First genetic evidence of GABA(A) receptor dysfunction in epilepsy: a mutation in the gamma2-subunit gene. Nat. Genet. 2001;1:46–48. - PubMed

Publication types

MeSH terms

LinkOut - more resources