. 2014 Feb;9(2):263-93.
doi: 10.1038/nprot.2014.012. Epub 2014 Jan 9.

Mapping Argonaute and conventional RNA-binding protein interactions with RNA at single-nucleotide resolution using HITS-CLIP and CIMS analysis

Affiliations

Mapping Argonaute and conventional RNA-binding protein interactions with RNA at single-nucleotide resolution using HITS-CLIP and CIMS analysis

Michael J Moore et al. Nat Protoc. 2014 Feb.

Erratum in

Abstract

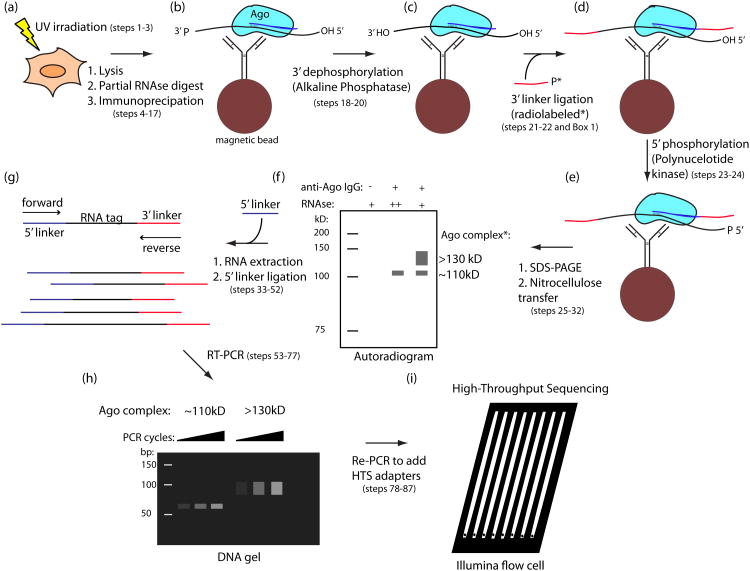
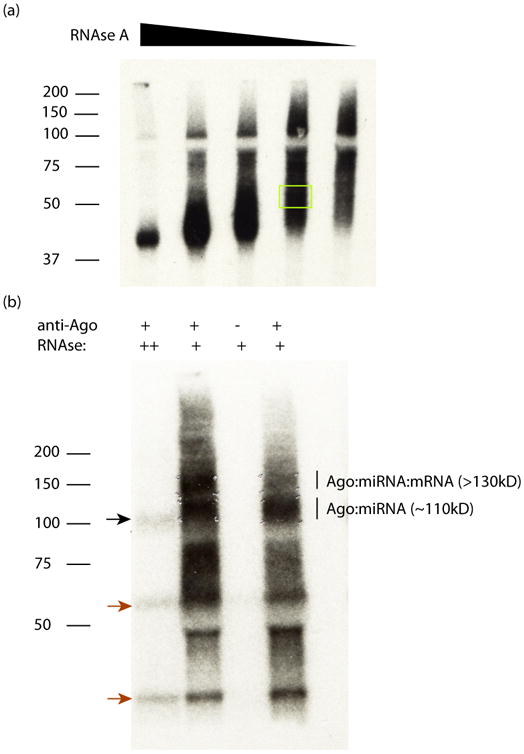
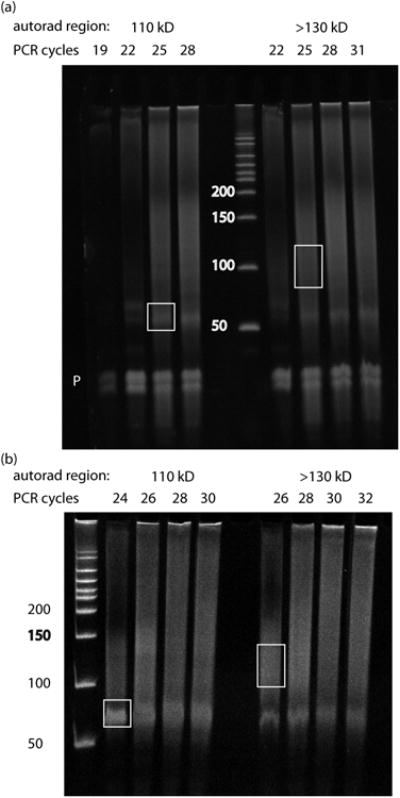
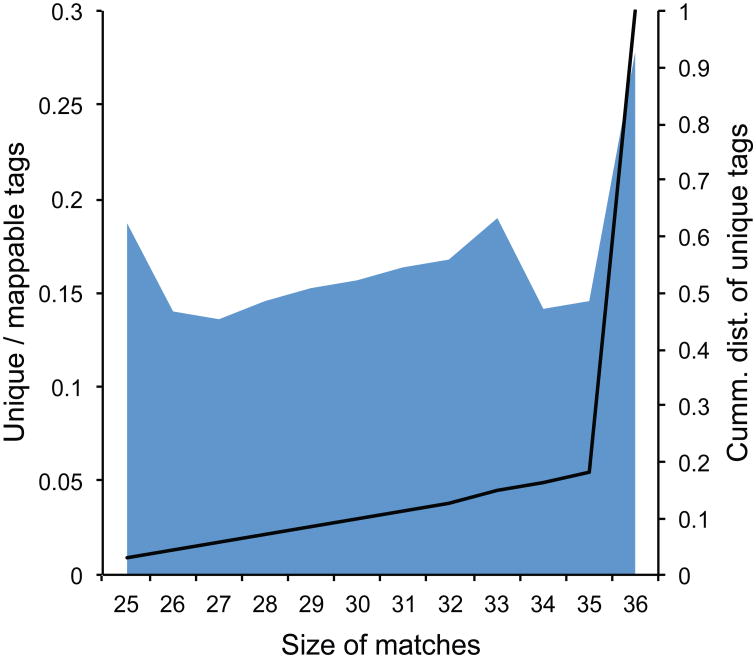
The identification of sites where RNA-binding proteins (RNABPs) interact with target RNAs opens the door to understanding the vast complexity of RNA regulation. UV cross-linking and immunoprecipitation (CLIP) is a transformative technology in which RNAs purified from in vivo cross-linked RNA-protein complexes are sequenced to reveal footprints of RNABP:RNA contacts. CLIP combined with high-throughput sequencing (HITS-CLIP) is a generalizable strategy to produce transcriptome-wide maps of RNA binding with higher accuracy and resolution than standard RNA immunoprecipitation (RIP) profiling or purely computational approaches. The application of CLIP to Argonaute proteins has expanded the utility of this approach to mapping binding sites for microRNAs and other small regulatory RNAs. Finally, recent advances in data analysis take advantage of cross-link-induced mutation sites (CIMS) to refine RNA-binding maps to single-nucleotide resolution. Once IP conditions are established, HITS-CLIP takes ∼8 d to prepare RNA for sequencing. Established pipelines for data analysis, including those for CIMS, take 3-4 d.


Figures

Figure 1
Figure 1. Overview of HITS-CLIP protocol
A scheme for the experimental portion of the protocol is shown for Ago, with the miRNA drawn in blue and the mRNA in black. Phosphate (P) or hydroxyl (OH) status of RNA ends are indicated where pertinent to the protocol. (a) UV irradiation of live cells or tissue induces RNA-protein crosslinks (steps 1-3). (b) Material is lysed, RNA is partially digested, and the target protein is immunopurified with antibody coupled to magnetic beads (steps 4-17). (c) Alkaline phosphatase treatment removes 3′ hydroxyl to permit 3′ linker ligation (steps 18-20). (d) Radiolabeled (*), 3′ linker (red) is ligated to RNA tags (steps 21-22). Note that two options for radiolabeling are presented in the protocol. The figure depicts use of a radiolabeled 3′ linker, done for Ago and other cases where direct polynucleotide kinase (PNK) labeling gives high background. (e) Polynucleotide kinase treatment phosphorylates 5′ RNA ends, allowing subsequent 5′ linker ligation (steps 23-24). (f) Complexes are eluted from beads and separated by SDS-PAGE. Following transfer to nitrocellulose membrane, complexes are visualized by autoradiography (steps 25-32). (g) RNA is extracted from the desired membrane region by protease treatment, and 5′ linker (purple) is ligated to tags (steps 33-52). (h) Tags are amplified by RT-PCR (steps 53-77). (i) Following addition of sequencing adapters in a second PCR step, samples are sequenced on the Illumina Platform (steps 78-87).
Figure 2
Figure 2. Sample CLIP autoradiograms (step 34)
(a) An autoradiogram is shown for CLIP of the RBP TIA1 purified from human CD4+ T-cells. A RNAse titration was performed, which shows the overdigested complex in the leftmost lane running as a single band near the predicted MW (∼42 kD), and a smear extending upwards for progressively lower RNAse concentrations. The yellow box indicates an appropriate region to cut out for RNA extraction. (b) An autoradiogram is shown for CLIP of Ago from human T-cells, using the monoclonal 2A8 pan-Ago antibody. The first lane is an overdigested control, showing the ∼110kD band (black arrow). At lower RNAse concentrations (lanes 2 and 4), two populations are visible: the ∼110 kD Ago:miRNA complex, and the >130 kD Ago:miRNA:mRNA complex. Lane 3 is a control mouse IgG, showing the dependence of signal on 2A8. Note that contaminant bands (red arrows) are present in 2A8 IPs; the SDS-PAGE size selection is critical to diagnose and remove these contaminants.
Figure 3
Figure 3. Sample RT-PCR from Ago CLIP experiments (step 71)
Two examples of RT-PCR from Ago HITS-CLIP experiments are shown, using samples from mouse T-cells (a) and mouse brain (b). In each case the 110 kD and >130 kD complexes were processed separately after isolation of RNA from the nitrocellulose membrane. PCR cycle numbers for each reaction are indicated above the gel. DNA size markers are indicated in bp. White boxes indicate gel regions that were excised and processed for high-throughput sequencing, as described in Anticipated Results. The ‘P’ in (a) indicates ‘primer-only’ products running below 50 bp, emphasizing the need for size selection and gel purification of appropriately sized products at this step. Primer-only products were run out of the gel in (b). Note that for the 110 kD complex, robust amplification of the ∼60 bp miRNA-dependent product occurs at earlier PCR cycles than for the >130 kD complex. Similarly, mRNA-dependent products, ideally a diffuse smear in the range from 85-110 bp, are enriched in the >130 kD complex. There is substantial cross-contamination between these populations, the degree of which varies according the resolution achieved at the SDS-PAGE step. However, we have found that separate, parallel isolation of these populations achieves higher complexity of mRNA tags, which represents a much more complex pool of sequences than the miRNA tags. Finally, note that products were excised from the lowest PCR cycles tested that gave robust signal. Plateaued signal and upward shift in modal size are indications of overamplification. Overamplification of tags, even by 1-2 cycles, can substantially reduce tag complexity.
Figure 4
Figure 4. Proportion of unique CLIP tags among all reads unambiguously mapped to the reference genome with regard to the size of the matched region (step 97)
This proportion (shaded area, left axis) will increase when less stringent filtering and mapping criteria are used, which is not observed here. The curve on the right axis shows cumulative proportion of unique tags. In this case, a vast majority of tags have long matched regions, another indication of the high signal-to-noise in the obtained unique tags after removal of PCR duplicates.
Fig. 5
Fig. 5. The positional profiles of each type of mutation relative to 5′ end of reads (step 105)
The y-axis shows the percentage of unique tags with a particular type of mutation in each position. (a) deletions; (b) substitutions; (c) insertions. The U shaped distribution for substitutions and deletions is characteristic of the positional sequencing error profile of the Illumina platform, while a higher rate of deletion in the middle (peaked at around positions 5-15) is a signature of protection from RNase digestion by the RNABP binding footprint.
Fig. 6
Fig. 6. Enrichment of miR-124 seed site matches in sequences [-10 nt, +10 nt] around robust CIMS (FDR≤0.001) (steps 110-11)
(a) The frequency of miR-124 seed matches (UGCCUU) relative to the position of reproducible deletion sites is plotted. The percentage of sites with miR-124 seed matches is shown on the vertical axis. Crosslinking predominantly occurs in positions immediately flanking the miR-124 seed match sequences. (b,c) Frequency of miR-124 seed matches relative to the position of reproducible deletion sites is plotted on positive (a) and negative (b) strands. Ambiguity in assigning the position of nucleotide deletions arises when crosslinking occurs in a stretch of the same nucleotide; novoalign assigns the deletion to the last position in the stretch relative to the positive strand. Therefore, CIMS on both strands are examined separately. The bimodal distribution of deletions is more evident when transcripts on both strands are separated. Below the graphs, the most frequent positions of miR-124 seed match sequences (UGCCUU, black) and the most frequently deleted nucleotides (red) are highlighted in panels (b) and (c).
Fig. 7
Fig. 7. An example of CIMS that precisely maps the Ago-miR-124-mRNA ternary complex (step 111)
(a) A robust CIMS (m=10 and k=34) identified in the 3′UTR of the Zcchc14 gene. A UCSC Genome Browser view of the Refseq gene Zcchc14 is shown with custom tracks for unique Ago HITS-CLIP mRNA tags (black profile) and deletions in unique CLIP tags (blue profile). (b) A zoomed-in view from (a) shows a miR-124 seed site match (shaded sequences at the bottom) in the “footprint” region of the Ago-miR-124-mRNA interaction. The seed site match is located in a region with high sequence conservation across vertebrate species, as suggested by the phyloP conservation scores. Deletions occur in one of three uridines (bracket underneath) at the 5′ end of the seed site match where a robust CIMS was identified.

References

    1. Czech B, Hannon GJ. Small RNA sorting: matchmaking for Argonautes. Nat Rev Genet. 2011;12:19–31. - PMC - PubMed
    1. Joshua-Tor L, Hannon GJ. Ancestral roles of small RNAs: an Ago-centric perspective. Cold Spring Harb Perspect Biol. 2011;3:a003772. - PMC - PubMed
    1. Fabian MR, Sonenberg N, Filipowicz W. Regulation of mRNA translation and stability by microRNAs. Annu Rev Biochem. 2010;79:351–379. - PubMed
    1. Chi SW, Zang JB, Mele A, Darnell RB. Argonaute HITS-CLIP decodes microRNA-mRNA interaction maps. Nature. 2009;460:479–486. - PMC - PubMed
    1. Gaken J, et al. A functional assay for microRNA target identification and validation. Nucleic Acids Res. 2012;40:e75. - PMC - PubMed

Publication types

MeSH terms