. 2014 Feb 14;343(6172):1248636.
doi: 10.1126/science.1248636. Epub 2014 Jan 9.

Toddler: an embryonic signal that promotes cell movement via Apelin receptors

Affiliations

Toddler: an embryonic signal that promotes cell movement via Apelin receptors

Andrea Pauli et al. Science. .

Abstract

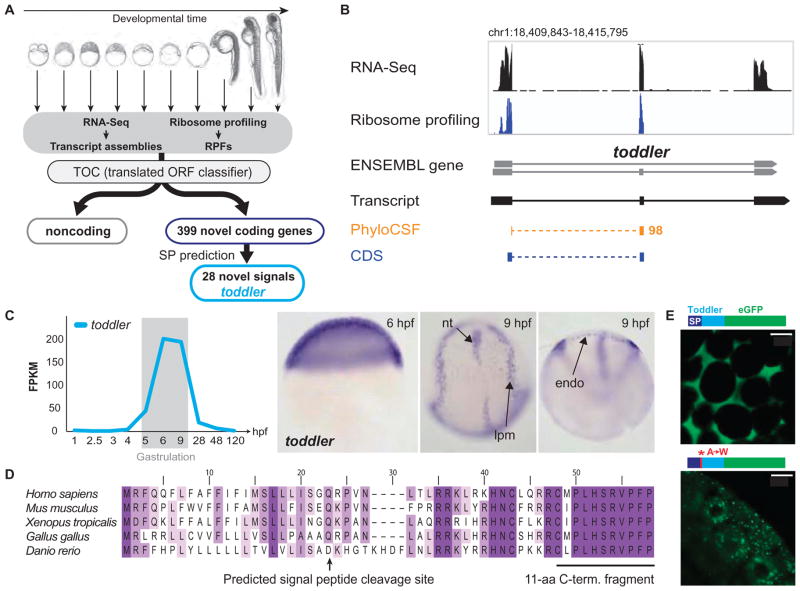
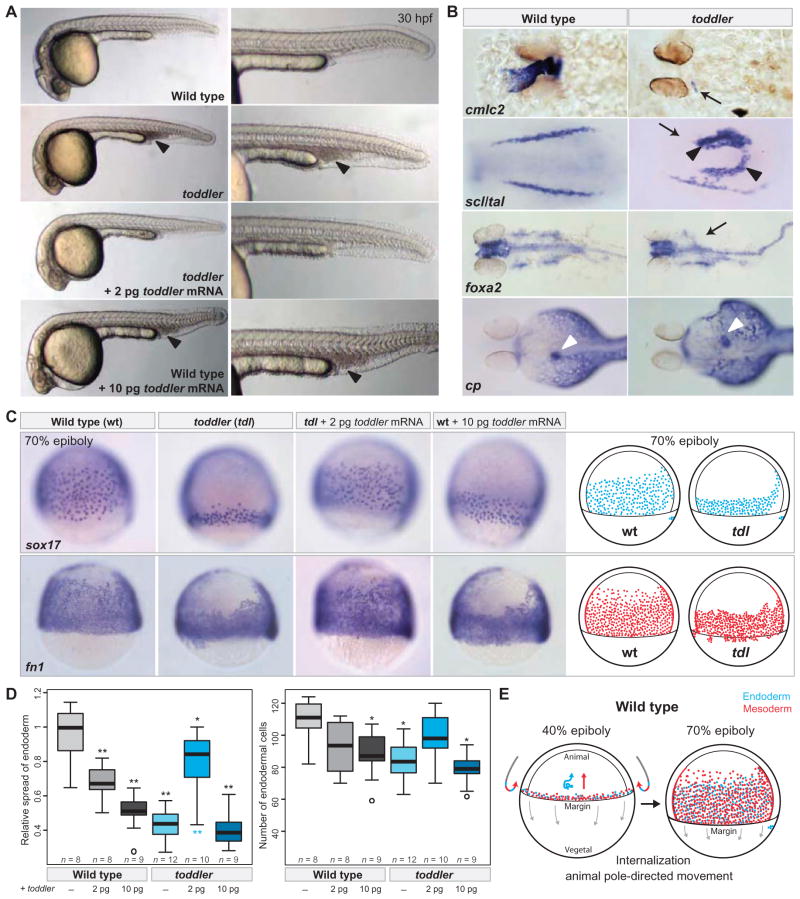
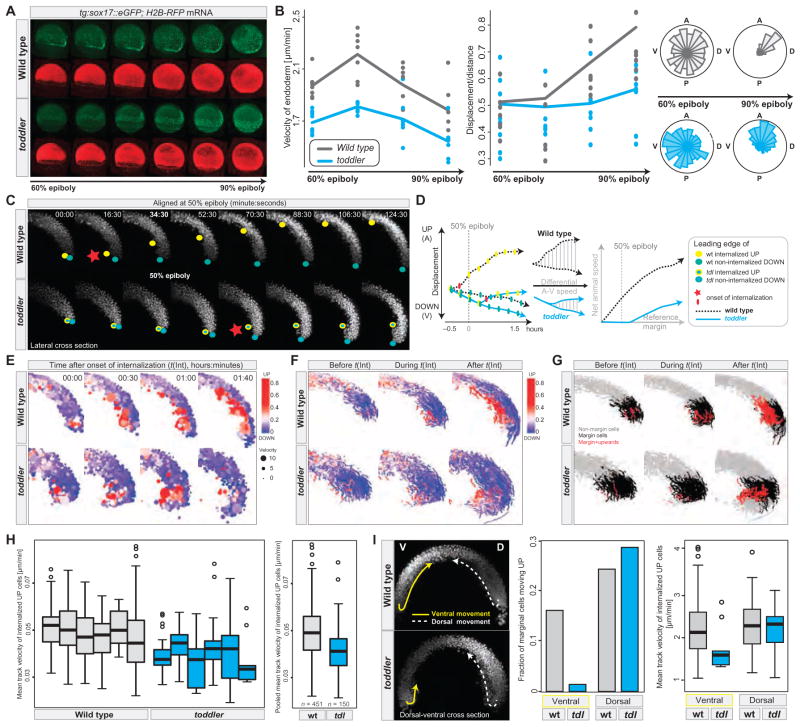
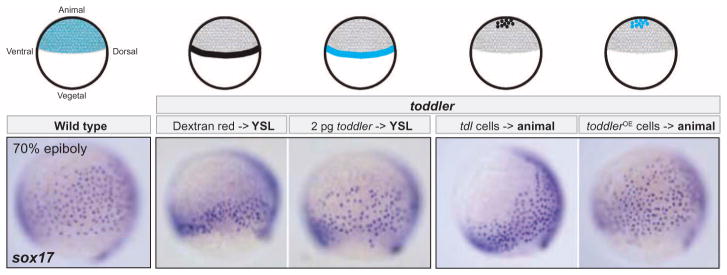
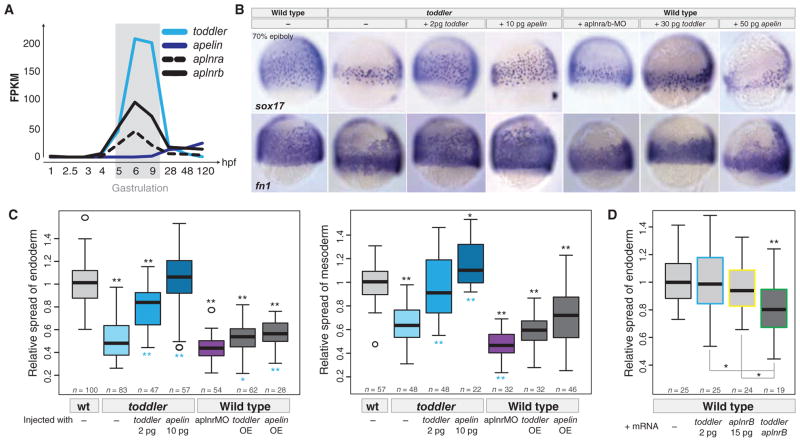
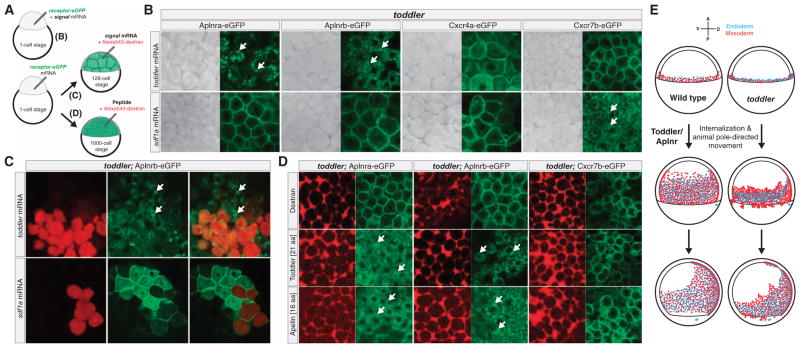
It has been assumed that most, if not all, signals regulating early development have been identified. Contrary to this expectation, we identified 28 candidate signaling proteins expressed during zebrafish embryogenesis, including Toddler, a short, conserved, and secreted peptide. Both absence and overproduction of Toddler reduce the movement of mesendodermal cells during zebrafish gastrulation. Local and ubiquitous production of Toddler promote cell movement, suggesting that Toddler is neither an attractant nor a repellent but acts globally as a motogen. Toddler drives internalization of G protein-coupled APJ/Apelin receptors, and activation of APJ/Apelin signaling rescues toddler mutants. These results indicate that Toddler is an activator of APJ/Apelin receptor signaling, promotes gastrulation movements, and might be the first in a series of uncharacterized developmental signals.


Figures

Fig. 1
Fig. 1. Identification of the novel embryonic signal Toddler
(A) Overview of the individual steps used to identify novel coding and noncoding transcripts. SP, signal peptide; RPFs, ribosome protected fragments. (B) Genomic features of toddler. Coverage tracks for RNA-Seq (black) and ribosome profiling (blue), and tracks outlining the highest scoring regions in PhyloCSF (orange). Note that both PhyloCSF (8) and ribosome profiling (7) predict toddler to be protein-coding. (C) Expression analysis of toddler transcripts during embryogenesis. toddler transcripts peak during gastrulation [RNA-Seq data (8)]. FPKM, fragments per kilobase of transcript per million mapped reads. RNA in situ hybridization reveals ubiquitous expression of toddler transcripts at the beginning of gastrulation [6 hours postfertilization (hpf)]; expression becomes restricted to mesendodermal cells toward the end of gastrulation (9 hpf). nt, notochord; lpm, lateral plate mesoderm; endo, endoderm. (D) Toddler is conserved in vertebrates. ClustalW2 multiple protein sequence alignment of Toddler peptide sequences from five vertebrates. Darker shading indicates higher percentage identity of the amino acid. The predicted signal peptide cleavage site and the highly conserved C-terminal 11–amino acid (aa) peptide fragment that was detected by mass spectrometry are indicated. (E) Toddler signal sequence drives secretion. Injection of mRNAs encoding C-terminal Toddler-eGFP fusion proteins reveals that the wild-type Toddler signal sequence drives secretion (extracellular localization of eGFP), whereas mutation of A→W in the signal peptide cleavage site causes Toddler-eGFP to remain intracellularly (top, wild-type Toddler ORF; bottom, A→W mutant Toddler ORF). Fusion protein diagrams are not drawn to scale. Scale bars, 20 μm.
Fig. 2
Fig. 2. Toddler is essential for embryogenesis
(A) Morphological analysis of toddler mutants. TALEN-induced toddler null mutants (see fig. S5) lack a functional heart, have no blood circulation, and accumulate blood posteriorly (black arrowheads). Defects in toddler mutant embryos are rescued by low doses (2 pg) of toddler mRNA. Injection of higher doses of toddler mRNA (≥10 pg) causes phenotypes in wild-type embryos reminiscent of toddler loss-of-function mutants. Shown are lateral views of embryos of the indicated genotypes at 30 hpf. (B) Marker gene analysis in wild-type and toddler mutant embryos at 36 hpf (cmlc2), at the 8 to 10 somite stage (scl/tal), at 30 hpf (foxa2), and at 3 days postfertilization [ceruloplasmin (cp)]. Black arrows indicate lack of or reduced staining in toddler mutant embryos; black arrowheads indicate ectopic expression; white arrowheads point to the liver in wild-type (>70% on left side) and toddler mutant embryos (expression: 45% right, 15% medial, 40% none/nonspecific). (C) Toddler is required for movement of ventrolateral endoderm and mesoderm toward the animal pole. Both absence of Toddler (toddler) and overexpression of toddler mRNA (wild-type embryos + 10 pg of toddler mRNA) reduce the movement of endodermal (sox17) and mesodermal [ fibronectin 1 ( fn1)] cells toward the animal pole, as detected by in situ hybridization. All in situ images are lateral views of embryos at 70% epiboly (dorsal to the right). Illustrations of the observed endodermal (blue) and mesodermal (red) phenotypes in wild-type (wt) and toddler mutant (tdl) embryos are shown on the right. (D) Quantification of the endodermal defects at 70% epiboly. Left, relative spread of lateral endoderm along the animal-vegetal axis (that is, height of lateral band of sox17-expressing cells divided by the wild-type mean); right, number of endodermal cells within a lateral, fixed-size area. Gray, wild-type genomic background; cyan, toddler mutant genomic background. P values for pairwise comparisons with wild-type (black, top) or toddler mutant (cyan, bottom) were calculated on the basis of a standard Welch’s t test (*P < 0.01; **P < 0.00001). (E) Illustration of early gastrulation movements in wild-type zebrafish embryos. Mesodermal (red) and endodermal (blue) cells are induced and internalized at the margin (40% epiboly stage). Whereas internalized cells migrate toward the animal pole in either a directional (mesoderm) or random walk–like pattern (endoderm) (3, 15), epiboly movements are directed toward the vegetal pole (gray arrows). At 70% epiboly, mesodermal and endodermal cells have moved animally and cover most of the lateral side of the embryo.
Fig. 3
Fig. 3. Abnormal gastrulation movements in toddler mutants
(A and B) Analysis of endodermal cell migration in sox17::eGFP transgenic wild-type and toddler mutant embryos by confocal microscopy. Green, endodermal cells (marked by sox17::eGFP); red, nuclei [human histone2B-RFP (H2B-RFP) mRNA injection]. (A) Still images of maximum intensity projections of a time-lapse movie from 60 to 90% epiboly (movies S1 and S2). (B) Quantification of the average (median) velocity of endodermal cells (left), displacement versus distance travelled (middle), and directionality (rose-plots; right) in wild-type (gray) and toddler mutant (cyan) embryos. Each dot represents the average speed (or the ratio between displacement versus distance travelled) of all endodermal cells tracked within a single embryo during a 45-min time interval with respect to its previous position [speed = actual distance (micrometers)/time (min)]. Shown are the data for four consecutive 45-min time windows. Roseplots display the random movement of endodermal cells during early gastrulation and the more directional migration at later stages [animal (A), posterior (P), dorsal (D), ventral (V)]. (C to I) Analysis of early gastrulation movements in H2B-RFP mRNA injected wild-type and toddler mutant embryos by light-sheet microscopy (single-plane illumination microscopy). (C to H) Internalization and animal pole–directed movement of lateral mesendodermal cells are reduced in toddler mutants. Analyses are shown for lateral cross sections of a time-lapse movie (movie S4) of a wild-type–toddler mutant embryo pair, imaged in parallel at 90-s intervals within a single experiment. (C) Still images of maximum intensity projections of 40-μm lateral cross sections (20 z-slices) during the time of internalization (time in minutes:seconds). Movies were aligned at 50% epiboly (48:00). Leading edges of internalizing mesendodermal cells (yellow dots) and vegetally moving cells (green dots) highlight the opposing paths of cells during gastrulation. Red stars mark the onset of cell internalization. (D) Comparison of animally and vegetally directed migratory paths of the wild-type and mutant embryo pair shown in (C). Frame-to-frame displacements (plotted on the left) were used to derive the net animal pole–directed cell movement. Toddler mutants (cyan) show delayed onset of internalization and reduced step-to-step and net animal pole–directed movement. (E to G) Cell tracking and digital analysis of gastrulation movements. (E) Position, speed (dot size), and directionality [color-coded from blue (vegetal movement) to red (animal movement)] of tracked cells during and after the time of internalization [t(Int)]. Movies were aligned to the onset of internalization [t(Int) = 00:00; time in hours:minutes]. (F and G) Cell tracks before (t < −5 min), during (−5 min < t < 1 hour), and after (t > 1 hour) internalization in wild-type and toddler mutant embryos. In (F), tracks were color-coded on the basis of the total number of animal pole–directed (red) or vegetal pole–directed (blue) movements, normalized to the total number of frames per track. In (G), tracks were color-coded on the basis of their relative position and directionality with respect to the margin at the time of internalization (margin cells: cells located within 100 μm above the margin at the onset of internalization). Gray, nonmargin cells; black, margin cells; red, internalizing and upward-moving margin cells. (H) Quantification of the mean velocity of internalizing, animal pole–directed movement in wild-type and toddler mutant embryos. Mean track velocities were obtained from cell-tracking data derived from lateral cross sections of six wild-type (gray) and six toddler mutant (cyan) embryos, imaged in parallel in three independent experiments. Pooled wild-type and toddler mutant mean track velocities are plotted on the right (n = number of cell tracks). (I) Toddler mutant embryos are defective in ventrolateral but not dorsal internalization. (Left) Still image of maximum intensity projections of 40-μm dorsal-ventral cross sections (20 z-slices) of a wild-type–toddler mutant embryo pair 110 min after the onset of internalization. Arrows highlight the paths that the leading internalizing cells took on dorsal (D, dashed white line) and ventral (V, solid yellow line) sides of the embryo. Ventral movement toward the animal pole is severely reduced in the toddler mutant embryo, whereas dorsal internalization occurs normally. (Right) Quantification of the fraction and speed of internalizing marginal cells based on their positioning in the embryo (dorsal versus ventral) and genotype [wild type (gray) versus toddler mutant (cyan)] (see also movie S6).
Fig. 4
Fig. 4. Toddler functions as a motogen
Ubiquitous or localized expression of Toddler promotes animal pole–directed endodermal cell migration in toddler mutant embryos. Toddler was expressed either vegetally from the yolk syncytial layer (YSL) (injection of toddler mRNA into the YSL) or animally from a toddler-overexpressing (OE) clone of cells transplanted into the animal pole. Dextran red injections into the YSL and transplantation of uninjected toddler mutant cells served as controls. Different treatments are illustrated on top; toddler expression domains are highlighted in cyan. All sox17 in situ hybridization images are lateral views of embryos at 70% epiboly (dorsal to the right).
Fig. 5
Fig. 5. Toddler acts via Apelin receptors
(A) RNA-Seq–based expression levels of toddler, apelin, and apelin receptors (aplnra and aplnrb) during embryogenesis. (B) Genetic evidence for Toddler signaling via the Apelin receptor. Endodermal (sox17) and mesodermal [ fibronectin 1 ( fn1)] cell distributions were analyzed by in situ hybridization at 70% epiboly. Apelin receptor knockdown [aplnra/b morpholino (MO) injection] phenocopies toddler mutants, and Apelin production can rescue toddler mutants. Overexpression of Apelin causes phenotypes resembling toddler mRNA overexpression. (C) Quantification of the relative lateral spread of endoderm (left) and mesoderm (right). Quantifications are from multiple experiments (n = number of embryos per category). P values for pairwise comparisons with wild type (black, top) or toddler mutant (cyan, bottom) were calculated on the basis of a standard Welch’s t test (*P < 0.01; **P < 0.00001). (D) Synergistic effect of Toddler and Apelin receptor b on endodermal cell migration. Injection of toddler or aplnrb mRNA at low concentrations (2 and 15 pg, respectively) did not cause significant defects in animal pole–directed movement of endodermal cells (different batch of toddler mRNA than used in Fig. 2D). However, coinjection of both mRNAs reduced the extent of endoderm movement. Shown are the combined data of two independent experiments. P values for pairwise comparisons with wild type (top) or individual mRNA injections (bottom) were calculated on the basis of a standard Welch’s t test (*P < 0.01; **P < 0.00001).
Fig. 6
Fig. 6. Toddler drives internalization of Apelin receptors
(A) Schematic illustration of different treatments used to test for Toddler-mediated Apelin receptor internalization. (B) Test for signal-mediated internalization of eGFP-tagged receptors in zebrafish by coinjection of signal and receptor-eGFP mRNA into one-cell stage toddler mutant embryos. Receptor internalization was monitored by confocal microscopy. White arrows point to fluorescent foci of internalized receptors. In the absence of signal peptide overexpression, ectopically expressed receptors localize to the plasma membrane in pregastrulation toddler mutant embryos [see control Alexa543-dextran injections in (D)]. (C) Generation of a local source of Toddler or Sdf1a by injection of toddler or sdf1a mRNA (together with Alexa543-dextran as tracer) into a single cell at the 128-cell stage. Local expression of Toddler is sufficient to cause Aplnrb-eGFP internalization in cells that do not express toddler mRNA (non-red cells). (D) Extracellular injection of in vitro–synthesized C-terminal Toddler or Apelin peptide fragments is sufficient to drive internalization of Apelin receptors. (E) Model of the role of Toddler-Apelin receptor signaling in mesendodermal cell migration during zebrafish gastrulation. Left, wild type; right, toddler; top, 40% epiboly (mesendoderm specification and internalization); middle, 70% epiboly (animal pole–directed cell movement); bottom, 90% epiboly (dorsal convergence).

References

    1. Alberts B, Johnson A, Lewis J, Raff M, Roberts K, Walter P. Molecular Biology of the Cell. 5. Garland Science; New York: 2007.
    1. Heisenberg CP, Bellaïche Y. Forces in tissue morphogenesis and patterning. Cell. 2013;153:948–962. doi: 10.1016/j.cell.2013.05.008. - DOI - PubMed
    1. Solnica-Krezel L, Sepich DS. Gastrulation: Making and shaping germ layers. Annu Rev Cell Dev Biol. 2012;28:687–717. doi: 10.1146/annurev-cellbio-092910-154043. - DOI - PubMed
    1. Wallingford JB. Planar cell polarity and the developmental control of cell behavior in vertebrate embryos. Annu Rev Cell Dev Biol. 2012;28:627–653. doi: 10.1146/annurev-cellbio-092910-154208. - DOI - PubMed
    1. Nowotschin S, Hadjantonakis AK. Cellular dynamics in the early mouse embryo: From axis formation to gastrulation. Curr Opin Genet Dev. 2010;20:420–427. doi: 10.1016/j.gde.2010.05.008. - DOI - PMC - PubMed

Publication types