

Genomic and phenotypic characterization of a wild medaka population: towards the establishment of an isogenic population genetic resource in fish
- PMID: 24408034
- PMCID: PMC3962483
- DOI: 10.1534/g3.113.008722
Genomic and phenotypic characterization of a wild medaka population: towards the establishment of an isogenic population genetic resource in fish
Abstract
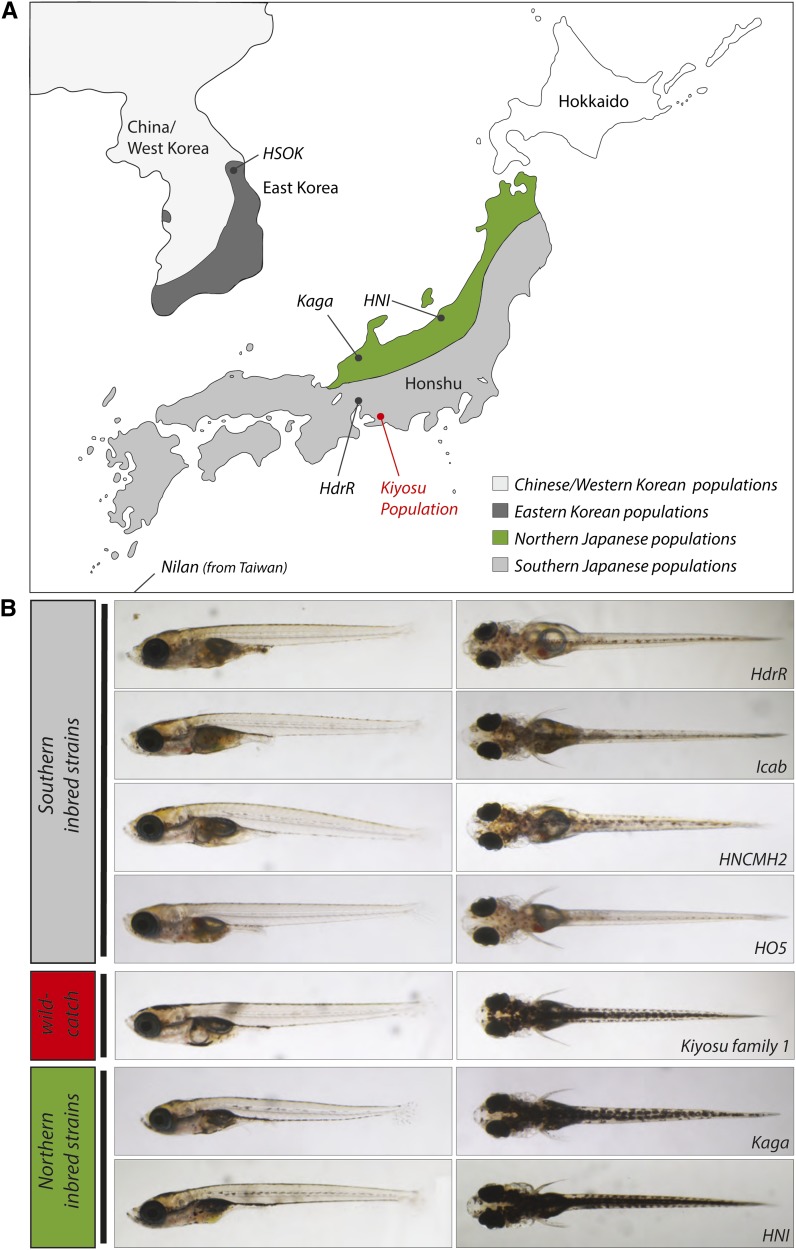
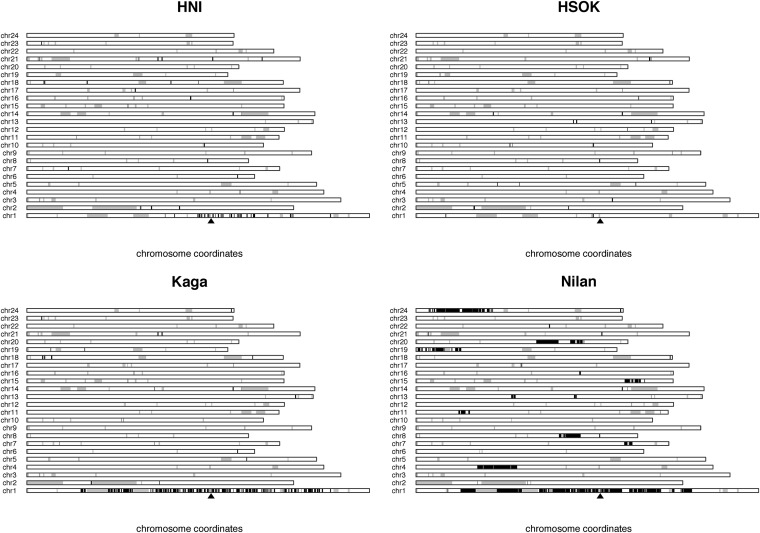
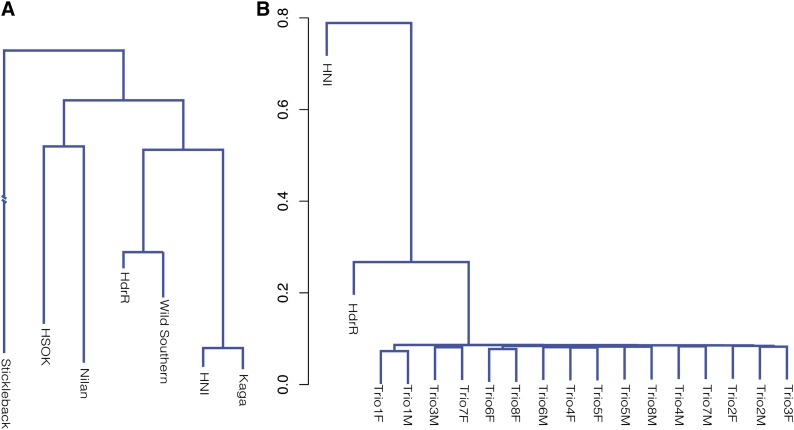
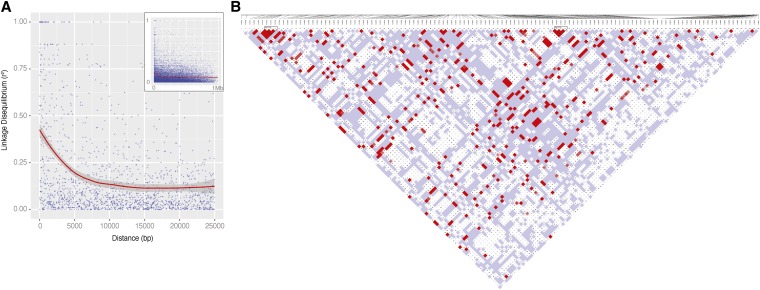
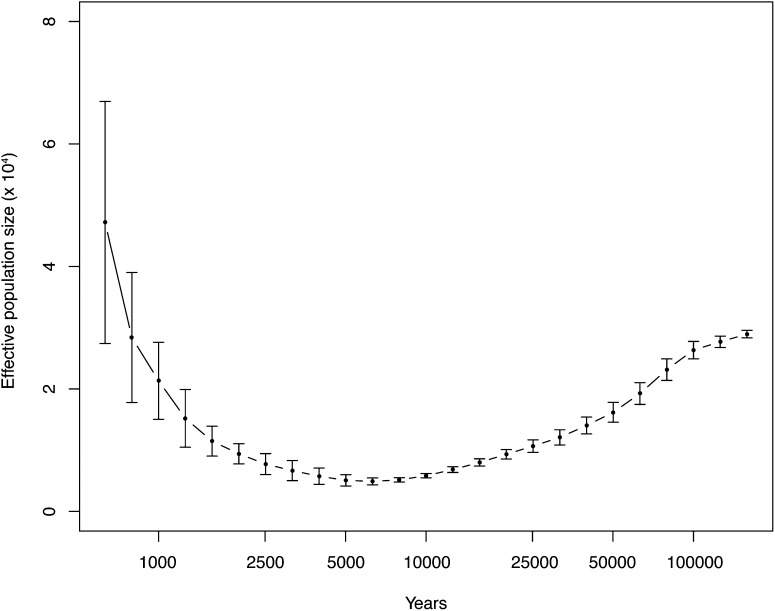
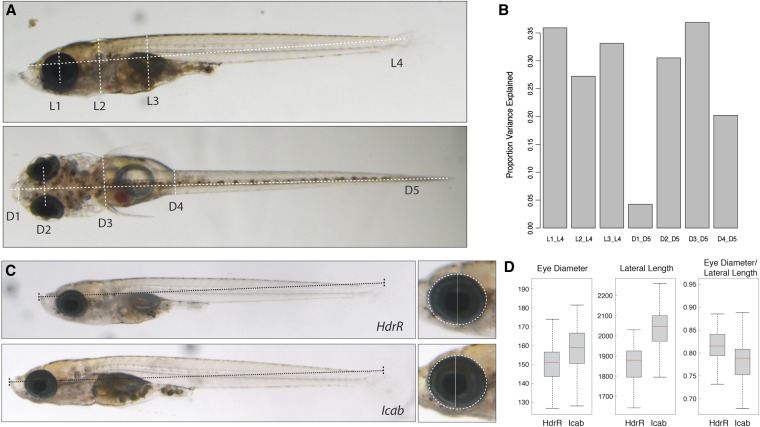
Oryzias latipes (medaka) has been established as a vertebrate genetic model for more than a century and recently has been rediscovered outside its native Japan. The power of new sequencing methods now makes it possible to reinvigorate medaka genetics, in particular by establishing a near-isogenic panel derived from a single wild population. Here we characterize the genomes of wild medaka catches obtained from a single Southern Japanese population in Kiyosu as a precursor for the establishment of a near-isogenic panel of wild lines. The population is free of significant detrimental population structure and has advantageous linkage disequilibrium properties suitable for the establishment of the proposed panel. Analysis of morphometric traits in five representative inbred strains suggests phenotypic mapping will be feasible in the panel. In addition, high-throughput genome sequencing of these medaka strains confirms their evolutionary relationships on lines of geographic separation and provides further evidence that there has been little significant interbreeding between the Southern and Northern medaka population since the Southern/Northern population split. The sequence data suggest that the Southern Japanese medaka existed as a larger older population that went through a relatively recent bottleneck approximately 10,000 years ago. In addition, we detect patterns of recent positive selection in the Southern population. These data indicate that the genetic structure of the Kiyosu medaka samples is suitable for the establishment of a vertebrate near-isogenic panel and therefore inbreeding of 200 lines based on this population has commenced. Progress of this project can be tracked at http://www.ebi.ac.uk/birney-srv/medaka-ref-panel.
Keywords: Medaka; inbreeding; population genomics; strain specific features.
Figures
Similar articles
-
The Medaka Inbred Kiyosu-Karlsruhe (MIKK) panel.Genome Biol. 2022 Feb 21;23(1):59. doi: 10.1186/s13059-022-02623-z. Genome Biol. 2022. PMID: 35189950 Free PMC article.
-
Genomic variations and epigenomic landscape of the Medaka Inbred Kiyosu-Karlsruhe (MIKK) panel.Genome Biol. 2022 Feb 21;23(1):58. doi: 10.1186/s13059-022-02602-4. Genome Biol. 2022. PMID: 35189951 Free PMC article.
-
Draft genome of the medaka fish: a comprehensive resource for medaka developmental genetics and vertebrate evolutionary biology.Dev Growth Differ. 2008 Jun;50 Suppl 1:S157-66. doi: 10.1111/j.1440-169X.2008.00992.x. Epub 2008 Apr 22. Dev Growth Differ. 2008. PMID: 18430160 Review.
-
Intraspecific variation in the mitochondrial genome among local populations of Medaka Oryzias latipes.Gene. 2010 Jun 1;457(1-2):13-24. doi: 10.1016/j.gene.2010.02.012. Epub 2010 Feb 26. Gene. 2010. PMID: 20193748
-
The genomic and genetic toolbox of the teleost medaka (Oryzias latipes).Genetics. 2015 Apr;199(4):905-18. doi: 10.1534/genetics.114.173849. Genetics. 2015. PMID: 25855651 Free PMC article. Review.
Cited by
-
Population genetic characteristics of Hainan medaka with whole-genome resequencing.Front Genet. 2022 Oct 12;13:946006. doi: 10.3389/fgene.2022.946006. eCollection 2022. Front Genet. 2022. PMID: 36313474 Free PMC article.
-
The chemical defensome of five model teleost fish.Sci Rep. 2021 May 18;11(1):10546. doi: 10.1038/s41598-021-89948-0. Sci Rep. 2021. PMID: 34006915 Free PMC article.
-
Natural allelic variations of xenobiotic-metabolizing enzymes affect sexual dimorphism in Oryzias latipes.Proc Biol Sci. 2014 Dec 22;281(1797):20142259. doi: 10.1098/rspb.2014.2259. Proc Biol Sci. 2014. PMID: 25377463 Free PMC article.
-
Complete fusion of a transposon and herpesvirus created the Teratorn mobile element in medaka fish.Nat Commun. 2017 Sep 15;8(1):551. doi: 10.1038/s41467-017-00527-2. Nat Commun. 2017. PMID: 28916771 Free PMC article.
-
A Whole Brain Staining, Embedding, and Clearing Pipeline for Adult Zebrafish to Visualize Cell Proliferation and Morphology in 3-Dimensions.Front Neurosci. 2018 Jan 17;11:750. doi: 10.3389/fnins.2017.00750. eCollection 2017. Front Neurosci. 2018. PMID: 29386991 Free PMC article.
References
-
- Asai T., Senou H., Hosoya K., 2011. Oryzias sakaizumii, a new ricefish from northern Japan (Teleostei: Adrianichthyidae). Ichthyol. Explor. Freshwat. 22: 289–299
-
- Bailey D. W., 1971. Recombinant-inbred strains. An aid to finding identity, linkage, and function of histocompatibility and other genes. Transplantation 11: 325–327 - PubMed
-
- Barrett J. C., Fry B., Maller J., Daly M. J., 2005. Haploview: analysis and visualization of LD and haplotype maps. Bioinformatics 21: 263–265 - PubMed
Publication types
MeSH terms
LinkOut - more resources
Full Text Sources
Other Literature Sources
Research Materials