. 2014 Jun;231(12):2461-70.
doi: 10.1007/s00213-013-3405-1. Epub 2014 Jan 10.

The effect of chronic amphetamine treatment on cocaine-induced facilitation of intracranial self-stimulation in rats

Affiliations

The effect of chronic amphetamine treatment on cocaine-induced facilitation of intracranial self-stimulation in rats

Clayton T Bauer et al. Psychopharmacology (Berl). 2014 Jun.

Abstract

Rationale: Chronic amphetamine treatment reduces cocaine self-administration in pre-clinical and clinical settings, and amphetamine has been proposed as a candidate medication for treatment of cocaine abuse.

Objective: The objective of the present study was to investigate whether chronic amphetamine treatment can decrease abuse-related cocaine effects in an assay of intracranial self-stimulation (ICSS).

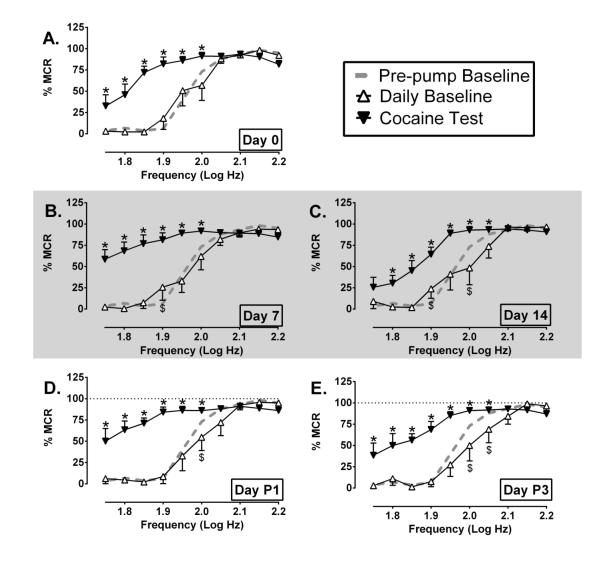
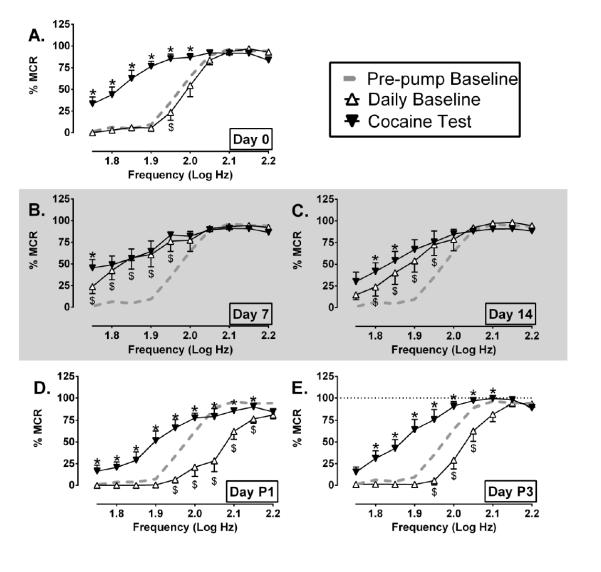
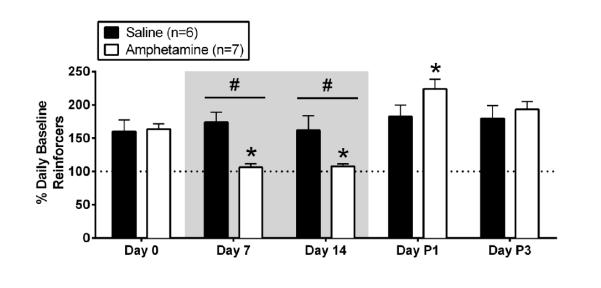
Methods: Thirteen adult male Sprague-Dawley rats were equipped with intracranial electrodes targeting the medial forebrain bundle and trained to lever press for pulses of brain stimulation in a "frequency-rate" ICSS procedure. Cocaine (10 mg/kg) was administered before (day 0), during (days 7 and 14), and after (posttreatment days 1 and 3) 2 weeks of continuous treatment with either amphetamine (0.32 mg/kg/h, n = 7) or saline (n = 6) via osmotic pump.

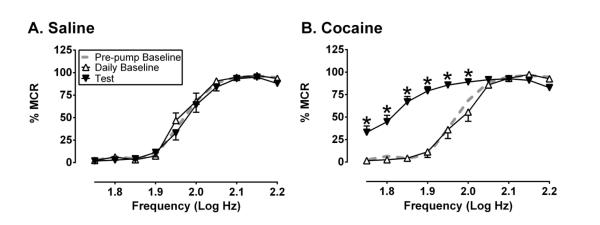
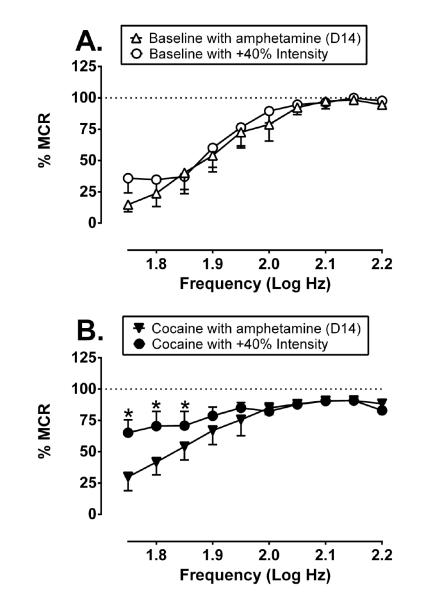
Results: Prior to treatment, cocaine facilitated ICSS in all rats. Saline treatment had no effect on baseline ICSS or cocaine-induced facilitation of ICSS at any time. Conversely, amphetamine produced a sustained though submaximal facilitation of baseline ICSS, and cocaine produced little additional facilitation of ICSS during amphetamine treatment. Termination of amphetamine treatment produced a depression of baseline ICSS and recovery of cocaine-induced facilitation of ICSS.

Conclusions: These data suggest that chronic amphetamine treatment blunts expression of abuse-related cocaine effects on ICSS in rats.


Figures

Figure 1
Figure 1. Saline and cocaine effects on ICSS before pump implantation
Abscissae: Frequency of electrical brain stimulation in Log Hz. Ordinates: ICSS rate expressed as percent maximum control rate (%MCR). Curves are shown for (1) the Pre-Pump Baseline, determined during a period of three days before implantation of saline or amphetamine osmotic pumps, (2) the Daily Baseline, determined on a given test day before saline or cocaine administration, and (3) the Saline or Cocaine Test, determined on a given test day after administration of saline or 10 mg/kg cocaine. All points show mean ± SEM for 13 rats. Asterisks denote points at which cocaine facilitated ICSS relative to the Daily Baseline, as indicated by a significant two-way ANOVA followed by a Holm-Sidak post-hoc test (p<0.05): A) Significant main effect of frequency [F (9, 108) = 173.5, p < 0.0001] but not treatment [F (2, 24) = 1.602, p = 0.2223], and the interaction was not significant [F (18, 216) = 1.115, p = 0.3386]. B) Significant main effect of frequency [F (9, 108) = 172.0, p < 0.0001] and treatment [F (2, 24) = 77.86, p < 0.0001], and a significant interaction [F (18, 216) = 23.43, p < 0.0001].
Figure 2
Figure 2. Cocaine effects on ICSS in saline-treated rats
Panels show ICSS frequency-rate curves determined before cocaine (Daily Baseline) and after administration of 10 mg/kg cocaine (Cocaine Test) on test days that occurred before (D0), during (D7, 14) and after (P1, 3) chronic treatment with saline delivered via osmotic pump. The Pre-Pump Baseline frequency-rate curve is also included in each panel for comparison. Gray shaded background indicates period of saline treatment. Abscissae: Frequency of electrical brain stimulation in Log Hz. Ordinates: ICSS rate expressed as percent maximum control rate (%MCR). All points show mean ± SEM for 6 rats. Dollar signs denote points of significant difference between Daily Baseline and Pre-Pump Baseline curves, and asterisks denote points at which cocaine facilitated ICSS relative to the Daily Baseline, as indicated by a significant two-way ANOVA followed by a Holm-Sidak post-hoc test (p<0.05): A) Significant main effect of frequency [F (9, 45) = 65.67, p < 0.0001] and treatment [F (2, 10) = 19.59, p = 0.0003], and a significant interaction [F (18, 90) = 8.822, p < 0.0001]. B) Significant main effect of frequency [F (9, 45) = 54.71, p < 0.0001] and treatment [F (2, 10) = 28.28, p < 0.0001], and a significant interaction [F (18, 90) = 13.58, p < 0.0001]. C) Significant main effect of frequency [F (9, 45) = 50.91, P < 0.0001] and treatment [F (2, 10) = 9.149, p = 0.0055], and a significant interaction [F (18, 90) = 5.411, p < 0.0001]. D) Significant main effect of frequency [F (9, 45) = 51.90, p < 0.0001] and treatment [F (2, 10) = 32.16, p < 0.0001], and a significant interaction [F (18, 90) = 10.74, p < 0.0001]. E) Significant main effect of frequency [F (9, 45) = 58.25, P < 0.0001] and treatment [F (2, 10) = 33.47, p < 0.0001], and significant interaction [F (18, 90) = 6.005, p < 0.0001].
Figure 3
Figure 3. Cocaine effects on ICSS in amphetamine-treated rats
Panels show ICSS frequency-rate curves determined before cocaine (Daily Baseline) and after administration of 10 mg/kg cocaine (Cocaine Test) on test days that occurred before (D0), during (D7, 14) and after (P1, 3) chronic treatment with amphetamine (0.32 mg/kg/hr) delivered via osmotic pump. The Pre-Pump Baseline frequency-rate curve is also included in each panel for comparison. Gray shaded background indicates period of amphetamine treatment. Abscissae: Frequency of electrical brain stimulation in Log Hz. Ordinates: ICSS rate expressed as percent maximum control rate (%MCR). All points show mean ± SEM for 7 rats except panel D. An equipment malfunction prevented data collection in one rat on Day P1, so Panel D shows data for only 6 rats. Dollar signs denote points of significant difference between Daily Baseline and Pre-Pump Baseline curves, and asterisks denote points at which cocaine facilitated ICSS relative to the Daily Baseline, as indicated by a significant two-way ANOVA followed by a Holm-Sidak post-hoc test (p<0.05): A) Significant main effect of frequency [F (9, 54) = 101.3, p < 0.0001] and treatment [F (2, 12) = 87.57, p < 0.0001], and a significant interaction [F (18, 108) = 16.24, p < 0.0001]. B) Significant main effect of frequency [F (9, 54) = 35.09, p < 0.0001] and treatment [F (2, 12) = 27.02, p < 0.0001], and a significant interaction [F (18, 108) = 8.347, p < 0.0001]. C) Significant main effect of frequency [F (9, 54) = 42.62, p < 0.0001] and treatment [F (2, 12) = 15.87, p = 0.0004], and a significant interaction F (18, 108) = 6.931, p < 0.0001[]. D) Significant main effect of frequency [F (9, 45) = 98.73, p < 0.0001] and treatment [F (2, 10) = 41.20, p < 0.0001], and a significant interaction [F (18, 90) = 8.184, p < 0.0001]. E) Significant main effect of frequency [F (9, 54) = 160.3, p < 0.0001] and treatment [F (2, 12) = 53.27, p < 0.0001], and a significant interaction [F (18, 108) = 7.471, p < 0.0001].
Figure 4
Figure 4. Summary of cocaine effects across time in each treatment group
Black and white bars show cocaine effects on ICSS in saline- and amphetamine-treatment groups, respectively. Gray shaded background indicates period of saline or amphetamine treatment via osmotic pump. Abscissa: Day of cocaine test before (Day 0), during (Days 7, 14) or after (Days P1, P3) treatment. Ordinate: Total number of stimulations per component after cocaine treatment expressed as a percent of total stimulations per component before cocaine treatment on that day (% Daily Baseline Reinforcers). All points show mean ± SEM for 6 or 7 rats. Asterisks denote a statistically significant difference in ICSS from Day 0 within a given treatment group, and pound symbols denote a statistically significant difference in ICSS between treatment groups on a given day, as indicated by a significant two-way ANOVA followed by a Holm-Sidak post-hoc test (p<0.05): Significant effect of time [F (4, 44) = 13.77, p < 0.0001] but not treatment group [F (1, 11) = 0.8450, p < 0.3777]. The interaction was significant [F (4, 44) = 8.606, p < 0.0001]. Note: As noted above, an equipment malfunction prevented data collection in one amphetamine-treated rat on Day P1; however, this rat completed the other four test sessions and displayed a cocaine effect similar to the group average. To permit inclusion of data for this rat in the overall analysis across days, the cocaine effect for this rat on Day P1 was assigned the mean effect for the other six amphetamine-treated rats that did complete testing on Day P1.
Figure 5
Figure 5. Cocaine effects on ICSS maintained by high-intensity stimulation
Panel A compares Daily Baseline ICSS frequency-rate curves determined on Day 14 of amphetamine treatment (open triangles) and after a 40% increase in stimulation intensity (open circles). Panel B shows ICSS frequency-rate curves determined after 10mg/kg cocaine on Day 14 of amphetamine (closed triangles) and at the increased stimulation intensity (closed circles). Abscissae: Frequency of electrical brain stimulation in Log Hz. Ordinates: ICSS rate expressed as percent maximum control rate (%MCR). All points show mean ± SEM for 7 rats. Asterisks denote points at which cocaine facilitated ICSS more in the +40% intensity condition than in the amphetamine treatment condition, as indicated by a significant two-way ANOVA followed by a Holm-Sidak post-hoc test (p<0.05): A) Significant main effect of (frequency [F(9,54) = 22.73, p<0.0001], but no main effect of amphetamine vs. +40% intensity [F(1,6) = 1.224, p=0.3110], and no interaction [F(9,54) = 0.7172, p=0.6909]). B) Significant main effect of frequency [F(9,54) = 8.074, p<0.0001], significant main effect of amphetamine vs. +40% intensity [F(1,6) = 9.954, p=0.0197], and a significant interaction [F(9,54) = 5.638, p<0.0001].

Similar articles

Cited by

References

    1. Anderson JL, Leith NJ, Barrett RJ. Tolerance to amphetamine's facilitation of self-stimulation responding: anatomical specificity. Brain Res. 1978;145(1):37–48. - PubMed
    1. Balster RL. Behavioral pharmacology: the current status. Liss; New York: 1985. Behavioral studies of tolerance and dependence; pp. 403–418.
    1. Banks ML, Blough BE, Negus SS. Effects of 14-day treatment with the schedule III anorectic phendimetrazine on choice between cocaine and food in rhesus monkeys. Drug Alcohol Depend. 2013;131(3):204–13. - PMC - PubMed
    1. Bauer CT, Banks ML, Blough BE, Negus SS. Use of intracranial self-stimulation to evaluate abuse-related and abuse-limiting effects of monoamine releasers in rats. British Journal of Pharmacology. 2013;168(4):850–862. - PMC - PubMed
    1. Bonano JS, Glennon RA, De Felice LJ, Banks ML, Negus SS. Abuse-related and abuse-limiting effects of methcathinone and the synthetic "bath salts" cathinone analogs ethylenedioxypyrovalerone (MDPV), methylone and mephedrone on intracranial self-stimulation in rats. Psychopharmacology (Berl) 2013 Epub ahead of print. - PMC - PubMed

Publication types

MeSH terms

LinkOut - more resources