. 2014 Mar;25(3):501-10.
doi: 10.1681/ASN.2013090988. Epub 2014 Jan 9.

Lithium causes G2 arrest of renal principal cells

Affiliations

Lithium causes G2 arrest of renal principal cells

Theun de Groot et al. J Am Soc Nephrol. 2014 Mar.

Abstract

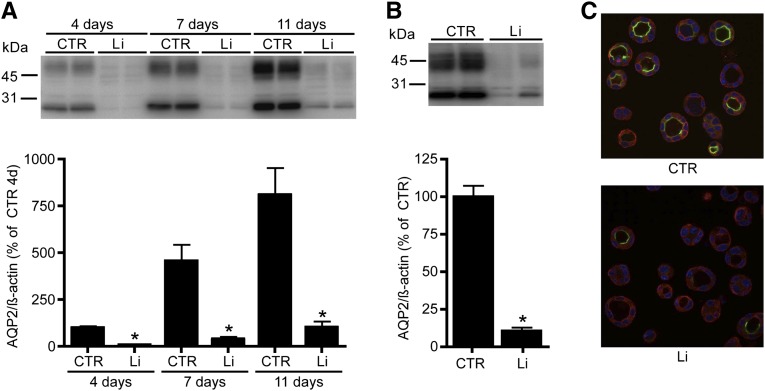
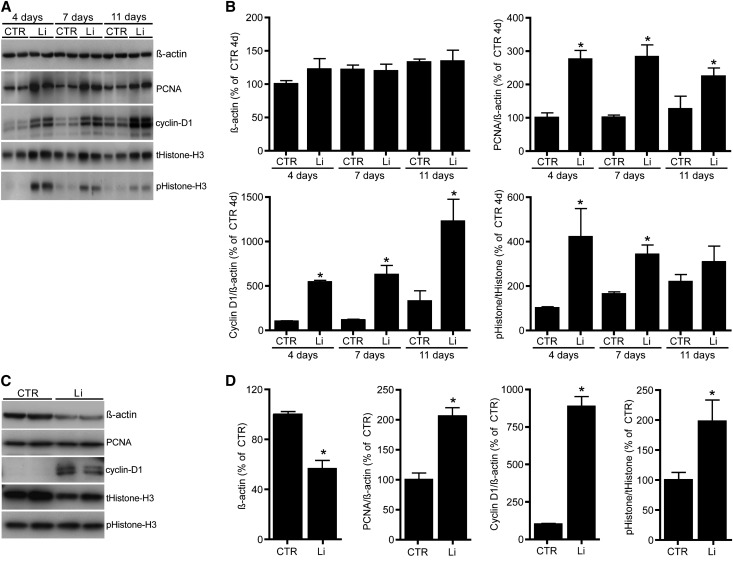
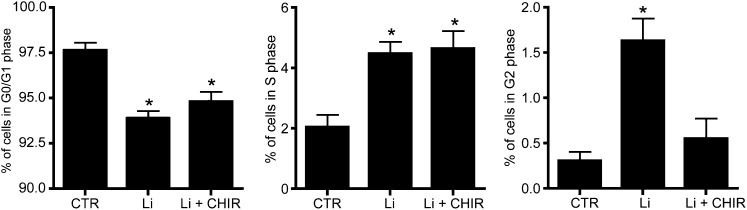
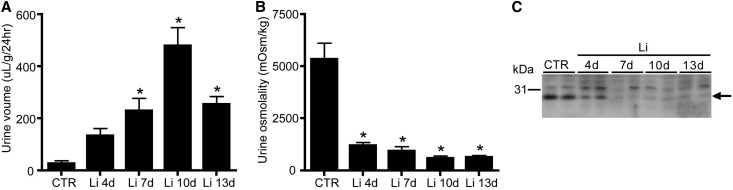
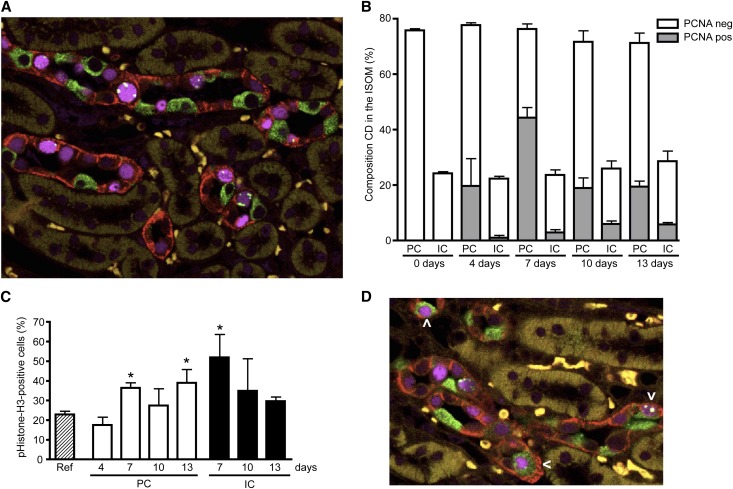
Vasopressin-regulated expression and insertion of aquaporin-2 channels in the luminal membrane of renal principal cells is essential for urine concentration. Lithium affects urine concentrating ability, and approximately 20% of patients treated with lithium develop nephrogenic diabetes insipidus (NDI), a disorder characterized by polyuria and polydipsia. Lithium-induced NDI is caused by aquaporin-2 downregulation and a reduced ratio of principal/intercalated cells, yet lithium induces principal cell proliferation. Here, we studied how lithium-induced principal cell proliferation can lead to a reduced ratio of principal/intercalated cells using two-dimensional and three-dimensional polarized cultures of mouse renal collecting duct cells and mice treated with clinically relevant lithium concentrations. DNA image cytometry and immunoblotting revealed that lithium initiated proliferation of mouse renal collecting duct cells but also increased the G2/S ratio, indicating G2/M phase arrest. In mice, treatment with lithium for 4, 7, 10, or 13 days led to features of NDI and an increase in the number of principal cells expressing PCNA in the papilla. Remarkably, 30%-40% of the PCNA-positive principal cells also expressed pHistone-H3, a late G2/M phase marker detected in approximately 20% of cells during undisturbed proliferation. Our data reveal that lithium treatment initiates proliferation of renal principal cells but that a significant percentage of these cells are arrested in the late G2 phase, which explains the reduced principal/intercalated cell ratio and may identify the molecular pathway underlying the development of lithium-induced renal fibrosis.


Figures

Figure 1.
Figure 1.
Lithium-induced AQP2 downregulation in two mpkCCD cell models. (A) mpkCCD cells are cultured on transwell filters to study the long-term effect of lithium (Li) treatment. After growth to confluence for 96 hours, cells are treated at the basolateral side with 1 mM lithium chloride and at the apical side with 10 mM lithium chloride. After 4, 7, and 11 days of lithium exposure, cells are collected, lysed, and immunoblotted for AQP2 (upper). Quantification is depicted in the lower panel (n=4 for each condition and time point). (B and C) mpkCCD cells are cultured in matrigel and treated with (Li) or without (CTR) 10 mM lithium chloride. After 3 days, cells are lysed and immunoblotted for AQP2 and signals are quantified, corrected for β-actin (n=4 for each condition). (C) Immunocytochemistry of 3D-grown mpkCCD cells. AQP2 expression is visualized in green, whereas α-tubulin and nuclear 4′,6-diamidino-2-phenylindole staining are depicted in red and blue, respectively. *P<0.05, significant difference from control (CTR).
Figure 2.
Figure 2.
Lithium treatment induces proliferation. (A) Representative cell cycle profiles of matrigel-cultured mpkCCD cells treated without (control, left) or with 10 mM lithium chloride for 3 days (right). The x-axis represents the DNA content of the nuclei population, whereas the y-axis identifies the number of nuclei. The DNA content per cell cycle phase is indicated. (B) Distribution of the cell cycle phases of mpkCCD cells cultured on transwell filters for 4, 7, or 11 days treated with (Li) or without (CTR) lithium chloride (n=6 for each condition and time point). (C) Averaged data of the distribution of the cell cycle phases of matrigel-cultured mpkCCD cells treated without (CTR) or with (Li) lithium chloride (n=4 for each condition). *P<0.05, significant difference from control (CTR).
Figure 3.
Figure 3.
The effect of lithium on different cell cycle markers. (A and C) mpkCCD cells are cultured and treated with lithium on Transwell filters (A) or in matrigel (C) as described in the legend for Figure 1. After three days, cells are lysed and immunoblotted for PCNA, cyclin D1, Histone H3, pHistone-H3, and β-actin. (B and D) Quantification of protein abundances of filter (A) or matrigel (C) grown cells, corrected for β-actin and related to the abundances of control cells of day 4 (n=4 for each condition and time point). *P<0.05, significant difference from control (CTR).
Figure 4.
Figure 4.
Lithium treatment of mpkCCD cells causes accumulation in the G2 phase. mpkCCD cells are cultured and treated with lithium on Transwell filters (A–C) or in matrigel (D–F) as described in the legend for Figure 1 and the percentage of cells in the G2 phase is determined (Transwell: n=6 for each condition and time point; matrigel: n=4 for each condition). Cell lysates of Transwell filter-cultured (B) or matrigel-cultured (D) cells are lysed and immunoblotted for cyclin B1, CDK1, pCDK1, and β-actin. (C and F) Quantification of protein abundances of filter (B) or matrigel (E) grown cells, corrected for β-actin and related to the abundances of control cells of day 4 (n=4 for each condition and time point). *P<0.05, significant difference from control (CTR).
Figure 5.
Figure 5.
Chk1 kinase blockage prevents lithium-induced cell cycle arrest. mpkCCD cells are grown and treated with or without lithium (Li) on Transwell filters for 4 days as described in the legend for Figure 1. Cells treated with lithium are cultured in the presence or absence of 500 nM of the Chk blocker CHIR-124. Cells are then trypsinized, stained, and analyzed by DNA image cytometry (n=5). *P<0.05, significant difference from control (CTR).
Figure 6.
Figure 6.
Lithium-treated mice develop NDI. Mice are exposed to food without (CTR) or with 40 mM lithium (Li) chloride/kg food for 4, 7, 10, and 13 days. Mice are placed in metabolic cages for 48 hours and urine output (A) and urine osmolality (B) are determined during the last 24 hours (n=6 per time points for CTR and Li 4–10 days; n=5 for Li 13 days). (C) AQP2 immunoblotting data of whole kidneys of control (CTR) and Li-treated mice. The arrow indicates AQP2. *P<0.05, significant difference from control (CTR).
Figure 7.
Figure 7.
Lithium causes a G2 cell cycle arrest of principal cells in vivo. Kidneys of mice treated or not with lithium chloride as described in the legend for Figure 6 are isolated, fixed, paraffin embedded, sectioned, and subjected to immunohistochemistry. Simultaneous staining is done for AQP4 (principal cell, red), H+-ATPase (intercalated cell, green), PCNA (nucleus, purple), and pHistone-H3 (G2 cell cycle phase, green). (A) Representative immunohistochemical staining of ISOM area of a mouse treated for 7 days with lithium. (B) Principal-intercalated cell composition (as a percentage of the total number of cells) of the collecting duct of the ISOM of mice treated for 0–13 days (indicated) with lithium and the percentage of PCNA-positive cells in principal and intercalated cells. For each time point, approximately 500 collecting duct cells per mouse for a total of three mice are counted. (C) Percentage of positive pHistone-H3 cells from the PCNA-positive population at days 4–13. (D) Immunohistochemical staining of a kidney after 10 days of lithium treatment. The arrowhead indicates cells that stain for markers of both intercalated and principal cells. *P<0.05, significant difference from the reference value, obtained from a renal cell population of nontreated mice. CD, collecting duct; IC, intercalated cell; neg, negative; PC, principal cell; pos, positive; ref, reference value.

Comment in

References

    1. Timmer RT, Sands JM: Lithium intoxication. J Am Soc Nephrol 10: 666–674, 1999 - PubMed
    1. Walker RJ, Weggery S, Bedford JJ, McDonald FJ, Ellis G, Leader JP: Lithium-induced reduction in urinary concentrating ability and urinary aquaporin 2 (AQP2) excretion in healthy volunteers. Kidney Int 67: 291–294, 2005 - PubMed
    1. Bendz H, Aurell M: Drug-induced diabetes insipidus: Incidence, prevention and management. Drug Saf 21: 449–456, 1999 - PubMed
    1. Geddes JR, Miklowitz DJ: Treatment of bipolar disorder. Lancet 381: 1672–1682, 2013 - PMC - PubMed
    1. Boone M, Deen PM: Physiology and pathophysiology of the vasopressin-regulated renal water reabsorption. Pflugers Arch 456: 1005–1024, 2008 - PMC - PubMed

Publication types

LinkOut - more resources