. 2014 Apr;31(4):889-902.
doi: 10.1093/molbev/msu040. Epub 2014 Jan 9.

Genomic analyses of three malaria vectors reveals extensive shared polymorphism but contrasting population histories

Affiliations

Genomic analyses of three malaria vectors reveals extensive shared polymorphism but contrasting population histories

Samantha M O'Loughlin et al. Mol Biol Evol. 2014 Apr.

Abstract

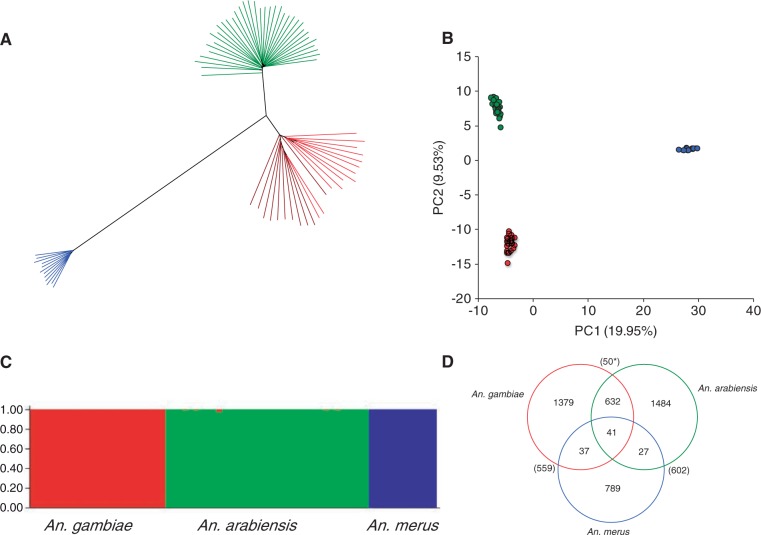
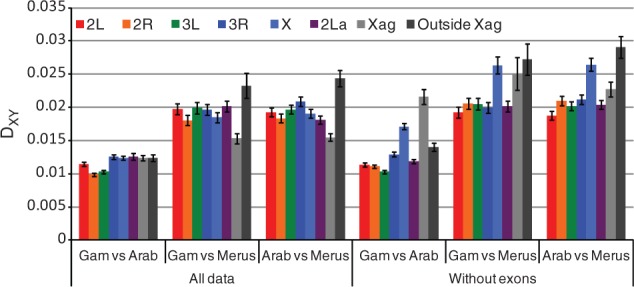
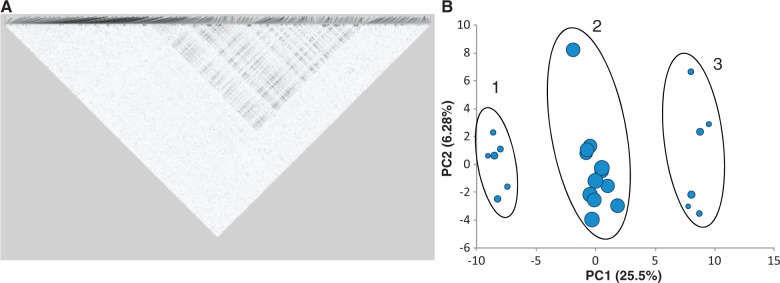
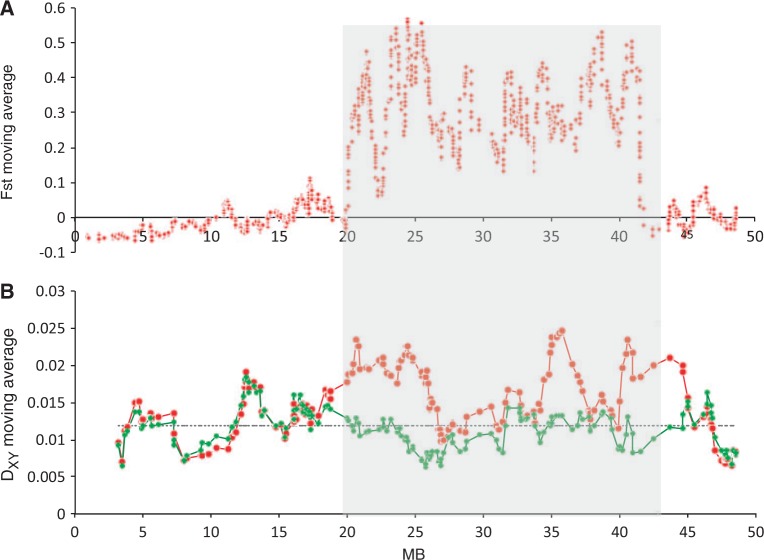
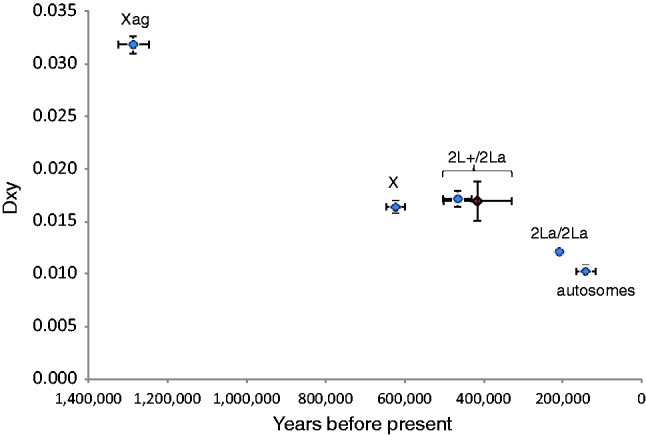
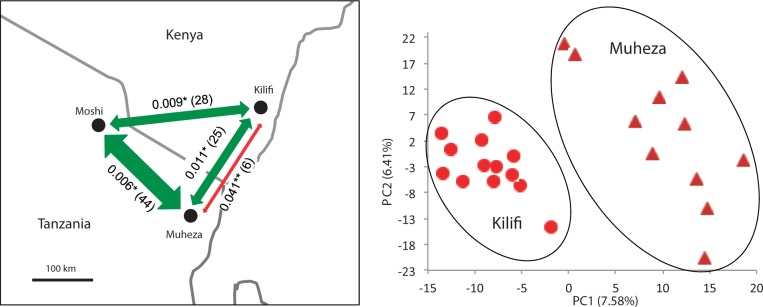
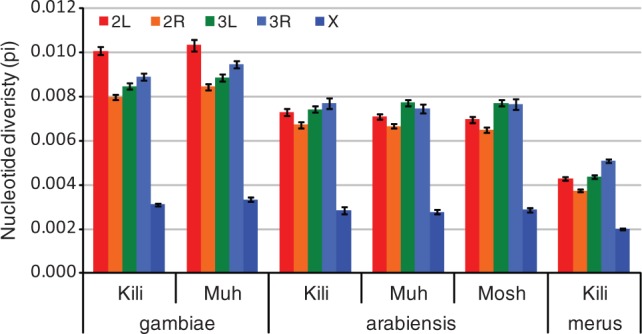
Anopheles gambiae s.l. are important malaria vectors, but little is known about their genomic variation in the wild. Here, we present inter- and intraspecies analysis of genome-wide RADseq data, in three Anopheles gambiae s.l. species collected from East Africa. The mosquitoes fall into three genotypic clusters representing described species (A. gambiae, A. arabiensis, and A. merus) with no evidence of cryptic breeding units. Anopheles merus is the most divergent of the three species, supporting a recent new phylogeny based on chromosomal inversions. Even though the species clusters are well separated, there is extensive shared polymorphism, particularly between A. gambiae and A. arabiensis. Divergence between A. gambiae and A. arabiensis does not vary across the autosomes but is higher in X-linked inversions than elsewhere on X or on the autosomes, consistent with the suggestion that this inversion (or a gene within it) is important in reproductive isolation between the species. The 2La/2L+(a) inversion shows no more evidence of introgression between A. gambiae and A. arabiensis than the rest of the autosomes. Population differentiation within A. gambiae and A. arabiensis is weak over approximately 190-270 km, implying no strong barriers to dispersal. Analysis of Tajima's D and the allele frequency spectrum is consistent with modest population increases in A. arabiensis and A. merus, but a more complex demographic history of expansion followed by contraction in A. gambiae. Although they are less than 200 km apart, the two A. gambiae populations show evidence of different demographic histories.

Keywords: 2La; Anopheles arabiensis; Anopheles gambiae; Anopheles merus; RADseq; population genomics.


Figures

F<sc>ig</sc>. 1.
Fig. 1.
Interspecies relationships. (A) Unrooted neighbor-joining tree based on average pairwise distances (DXY), using 4,711 autosomal SNPs. (B) Principal components analysis of 847 autosomal SNPs (one SNP chosen randomly per tag location). (C) Results from a Bayesian cluster analysis of one SNP per tag location using STRUCTURE. The highest log-likelihood was for three populations (k = 1–5 tested). The three populations corresponded to the three species, and each individual was assigned almost entirely to one population, with only one exception (KA11, see text and supplementary results, Supplementary Material online, for further details). Each individual is represented by a vertical bar. Analysis carried out using one SNP per RAD tag location (913 genome-wide SNPs). (D) Venn diagram showing number of private and shared polymorphisms for the whole genome. Also shown in brackets are the numbers of fixed differences between the species. *Fixed differences between Anopheles gambiae and A. arabiensis increase to 60 when sample KA11 is excluded. Color scheme: red = A. gambiae (in the phylogeny, light red = Kilifi, dark red = Muheza), green = A. arabiensis, blue = A. merus. All analyses are from SNP set 1.
F<sc>ig</sc>. 2.
Fig. 2.
Divergence (as measured by DXY) between different species pairs, for different regions of the genome. Data set 1, with and without exons. Error bars show ± 1 SD.
F<sc>ig</sc>. 3.
Fig. 3.
(A) Grid plot of LD r2 for Anopheles gambiae chromosome 2L (N = 24) and (B) PCA plot of 156 SNPs within the 2L+a inversion. The circles are scaled to the level of average heterozygosity for each sample. The location of the region of high LD corresponds to the known chromosomal coordinates of 2L+a, e.g., those published on Vectorbase. SNP set 3.
F<sc>ig</sc>. 4.
Fig. 4.
Sliding windows of FST and DXY between inversions. Shaded area denotes location of 2L+a inversion. (A) Anopheles gambiae 2La/a and 2L+/+ samples, across chromosome 2L (1,489 SNPs). FST measured locus-by-locus and averaged in a 25 SNP window moving in 1 SNP steps. Average FST for 2La = 0.567. SNP set 3. (B) Average pairwise nucleotide divergence (DXY) across chromosome 2L (18,065 sites) for A. gambiae and A. arabiensis. 1,000 site sliding window in 100 site steps. Red: DXY between A. gambiae 2L+/+ homokaryotype samples and A. arabiensis; Green: DXY between A. gambiae 2La/a homokaryotype samples and A. arabiensis. Gray dotted line shows autosome average DXY. Data set 2.
F<sc>ig</sc>. 5.
Fig. 5.
Noncoding divergence between A. gambiae and A. arabiensis at different parts of the genome. x axis: time from present calculated from net pairwise divergence (DA) using DA = 2µT (see Materials and Methods for value of µ); y axis = DXY. Data points: Xag (2,234 sites), X outside Xag (2,006 sites), 2La (8,475 sites), and autosomes excluding 2La (58,752 sites). Data excludes exons. Blue diamonds represent comparisons between A. arabiensis and A. gambiae. The red diamond represents the comparison between the two 2La homokaryotypes in A. gambiae. Data set 2.
F<sc>ig</sc>. 6.
Fig. 6.
Population structure of A. gambiae and A. arabiensis. Left panel: FST and migration (Nm) between sample sites. Green arrows connect A. arabiensis populations, red arrow A. gambiae populations. *P < 0.05, **P < 0.0001. Data sets 3 and 4. Right panel: PCA of A. gambiae SNPs. PCA on one randomly chosen SNP per tag, all tags (1,593 SNPs). Light red circles = samples from Kilifi, Kenya, dark red triangles = samples from Muheza, Tanzania. PCA results were consistent across three data sets of one random SNP per tag. Data set 3.
F<sc>ig</sc>. 7.
Fig. 7.
Nucleotide diversity (π) for each population and chromosome arm. From single species data sets 3, 4, and 5. Kili = Kilifi, Muh = Muheza, Mosh = Moshi.

Similar articles

Cited by

References

    1. Andolfatto P, Depaulis F, Navarro A. Inversion polymorphisms and nucleotide variability in Drosophila. Genet Res. 2001;77:1–8. - PubMed
    1. Arnold B, Corbett-Detig RB, Hartl D, Bomblies K. RADseq underestimates diversity and introduces genealogical biases due to nonrandom haplotype sampling. Mol Ecol. 2013;22:3179–3190. - PubMed
    1. Ayala FJ, Coluzzi M. Chromosome speciation: humans, Drosophila, and mosquitoes. Proc Natl Acad Sci U S A. 2005;102:6535–6342. - PMC - PubMed
    1. Bachtrog D. Evidence for male-driven evolution in Drosophila. Mol Biol Evol. 2008;25:617–619. - PubMed
    1. Baird NA, Etter PD, Atwood TS, Currey MC, Shiver AL, Lewis ZA, Selker EU, Cresko WA, Johnson EA. Rapid SNP discovery and genetic mapping using sequenced RAD markers. PLoS One. 2008;3:e3376. - PMC - PubMed

Publication types