. 2014 Apr;31(4):903-16.
doi: 10.1093/molbev/msu042. Epub 2014 Jan 9.

Ancestral resurrection of the Drosophila S2E enhancer reveals accessible evolutionary paths through compensatory change

Affiliations

Ancestral resurrection of the Drosophila S2E enhancer reveals accessible evolutionary paths through compensatory change

Carlos Martinez et al. Mol Biol Evol. 2014 Apr.

Abstract

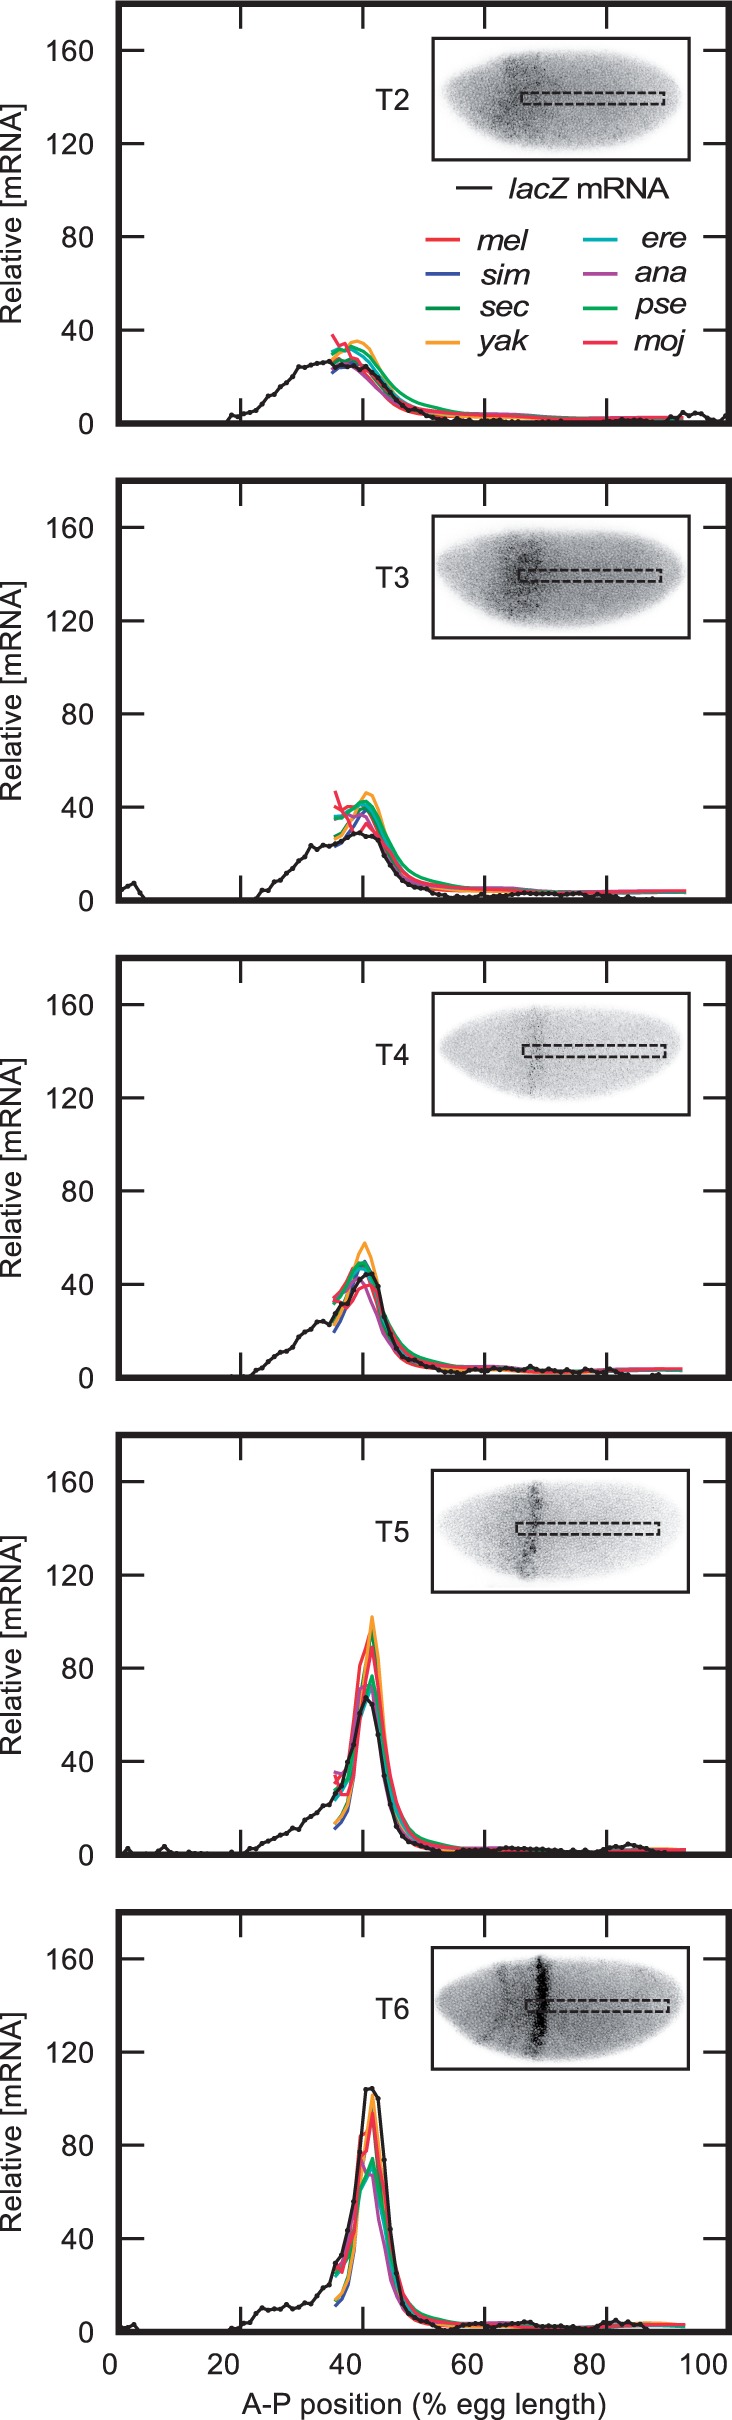
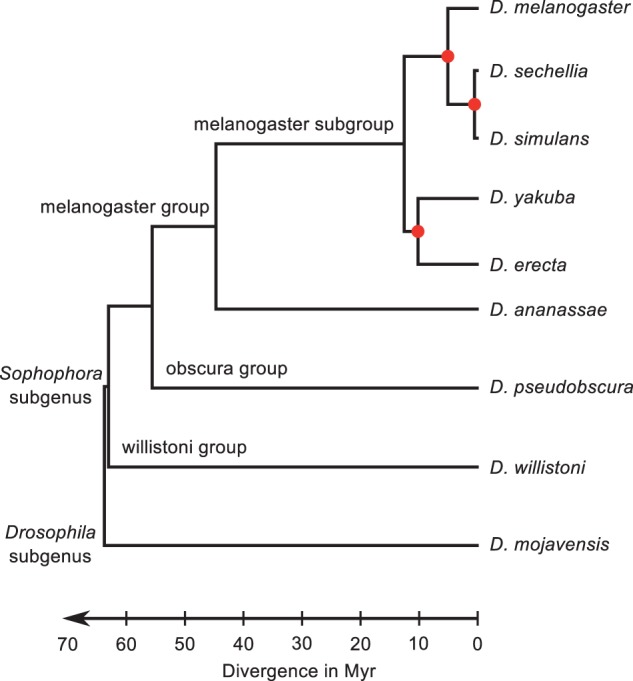
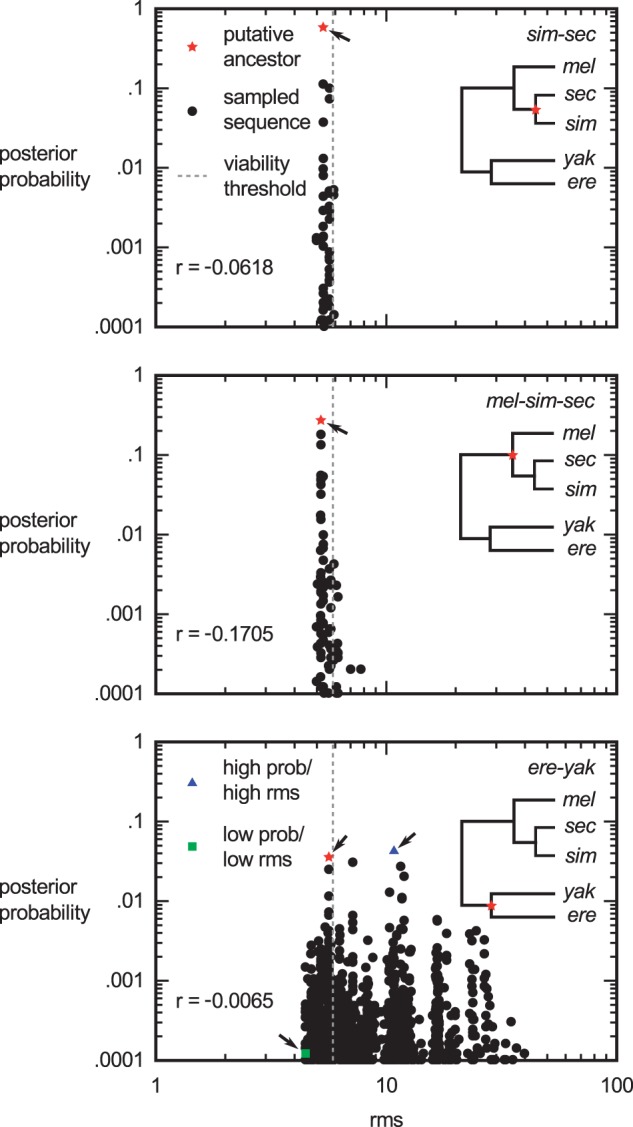
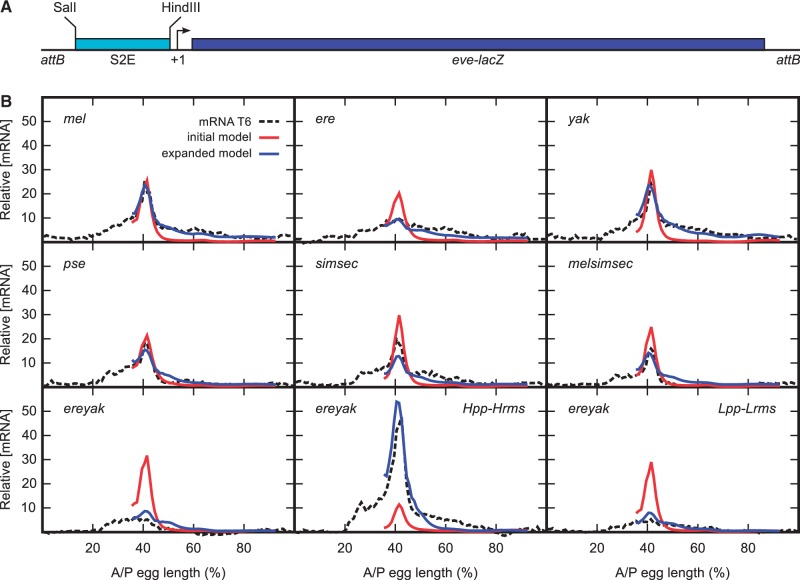
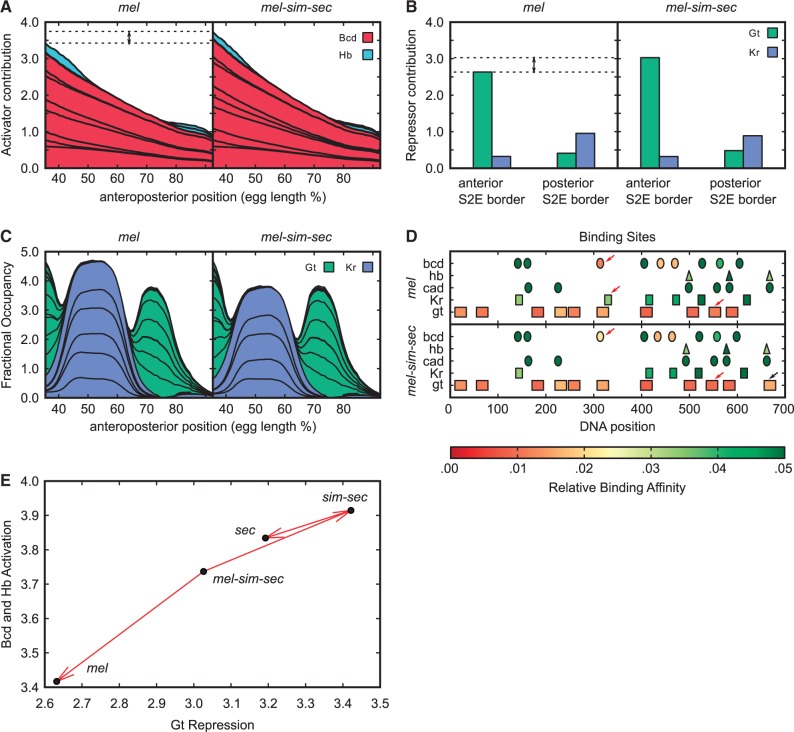
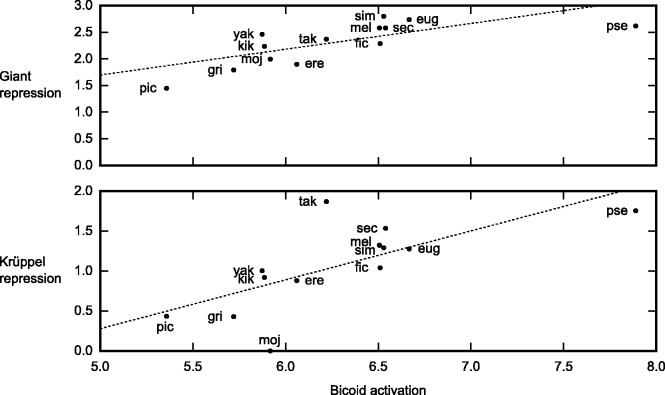
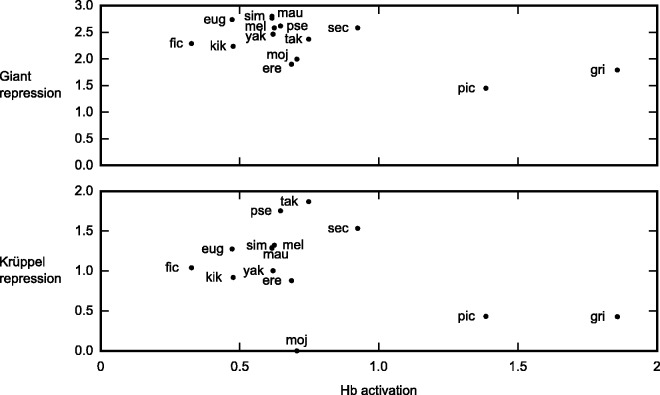
Upstream regulatory sequences that control gene expression evolve rapidly, yet the expression patterns and functions of most genes are typically conserved. To address this paradox, we have reconstructed computationally and resurrected in vivo the cis-regulatory regions of the ancestral Drosophila eve stripe 2 element and evaluated its evolution using a mathematical model of promoter function. Our feed-forward transcriptional model predicts gene expression patterns directly from enhancer sequence. We used this functional model along with phylogenetics to generate a set of possible ancestral eve stripe 2 sequences for the common ancestors of 1) D. simulans and D. sechellia; 2) D. melanogaster, D. simulans, and D. sechellia; and 3) D. erecta and D. yakuba. These ancestral sequences were synthesized and resurrected in vivo. Using a combination of quantitative and computational analysis, we find clear support for functional compensation between the binding sites for Bicoid, Giant, and Krüppel over the course of 40-60 My of Drosophila evolution. We show that this compensation is driven by a coupling interaction between Bicoid activation and repression at the anterior and posterior border necessary for proper placement of the anterior stripe 2 border. A multiplicity of mechanisms for binding site turnover exemplified by Bicoid, Giant, and Krüppel sites, explains how rapid sequence change may occur while maintaining the function of the cis-regulatory element.

Keywords: enhancer; evolution; modeling; transcription.


Figures

Fig. 1.
Fig. 1.
Model fit to eight homologous S2E sequences using MSE2 expression as reference shows good fit to all sequences. Shown are the calculated expression patterns for the homologous S2E enhancers from Drosophila mel, D. sim, D. sec, D. sim, D. yak, D. ere, D. ana, D. pse, and D. moj at different stages during nuclear division cycle 14A. The interphase of nuclear division cycle 14A is approximately 50-min long and has been partitioned into eight time classes (T1–T8) each about 6 min in length as previously described (Surkova, Kosman, et al. 2008). Only time classes T2–T6 were used in the model fit. The dotted line corresponds to the observed expression pattern of a P-element transformant line expressing eve–lacZ under control of the D. mel MSE2. The observed D. mel MSE2 pattern was used as a reference in the model fit. The rms score between the model calculated pattern for all species and the reference D. mel MSE2 expression was 5.24. Figure inset in each time class shows a representative in situ hybridization and the dashed box shows the embryo region being modeled (35.5–93.5% EL).
F<sc>ig</sc>. 2.
Fig. 2.
Phylogenetic relationships of all Drosophila species used in the initial model fit and alignment. Red circles denote the internal nodes of the Drosophila phylogenetic tree where the Bayesian inference reconstruction of ancestral eve S2E sequences was carried out. The length of the branches in the tree is scaled according to divergence times. The last common ancestor between mel and moj was 62.9 Ma, between mel and wil 62.2 Ma, between mel and obs 54.9 Ma, between mel and ana 44.2 Ma. Divergence times for the inferred ancestral S2E sequences were 0.93, 5.4, and 10.4 My for the sim–sec, mel–sim–sec, and ere–yak ancestors, respectively. Divergence times are genomic mutation-clock based estimates (Tamura et al. 2004).
F<sc>ig</sc>. 3.
Fig. 3.
Scatter plot of the phylogenetic posterior probability and the predicted rms score of sampled S2E sequences show no correlation. Top, middle, and bottom panels show the scatter plots for the sampled S2E sequences from the sim–sec (n = 118), mel–sim–sec (n = 250), and ere–yak (n = 6,234) internal nodes of the Drosophila phylogenetic tree. Each black dot represents a single sampled sequence. The vertical axis corresponds to the posterior probability of each ancestral sequence based on phylogenetic inference. The rms score between the predicted expression pattern given by the transcriptional model and the reference MSE2 pattern of the eve–lacZ reporter line. The value of the Pearson product–moment correlation coefficient (r) is shown in each panel. No correlation between the posterior probabilities of the sequence and the corresponding model rms was observed. The dotted line marks the viability threshold, defined as the maximum calculated rms score for all eight homologous sequences used in the model fit (rms = 5.68). The red star (arrow) to the left of the viability threshold represents the putative ancestral S2E selected for synthesis and experimental validation. The putative ancestral S2E for each internal node corresponds to the sequence with the highest posterior probability from the subset of sampled sequences with an rms below the viability threshold. In the case of the ere–yak internal node, two additional sequences were selected as controls. The blue triangle (arrow) represents a sampled sequence with a high posterior probability and high rms (ere–yak/Hpp-Hrms). The green triangle (arrow) represents a sampled sequence with a low posterior probability and low rms (ere–yak/Lpp-Lrms). Each panel contains a figure inset showing a part of the Drosophila phylogenetic tree with a red star over the sampled internal node.
F<sc>ig</sc>. 4.
Fig. 4.
Comparison of predicted and in vivo expression of the reconstructed ancestral S2E sequences for sim–sec and mel–sim–sec at T6. (A) Schematic diagram of attB donor vector used for site-specific integration. S2E sequences driving eve–lacZ expression were placed 42 bp upstream of the transcription start site. (B) Quantitated expression data observed from four extant and eight putative ancestral sequences during time class T6 of nuclear division cycle 14A. The dashed line represents the observed expression data. The number of embryos used per time class and reporter line are listed in supplementary table S6, Supplementary Material online. The solid red line corresponds to the initial model fit. The solid blue line corresponds to the extended model fit.
F<sc>ig</sc>. 5.
Fig. 5.
Comparative functional analysis shows compensatory evolution between Bcd and Gt sites. (A) Sum of the activating contributions for all Bcd and Hb binding sites. Red and light blue colored areas represent activating contributions by individual Bcd and Hb binding sites, respectively. Activating contributions were calculated in the absence of Kr and Gt sites. The height of each colored area is given by supplementary equation (S14) (Supplementary Material online). Comparison of the maximum Bcd and Hb activating contribution between mel and mel–sim–sec show a decrease in mel relative to mel–sim–sec. (B) Contributions of Gt and Kr in forming the anterior and posterior eve stripe 2 boundaries. Repressive contributions of Gt and Kr at the stripe 2 border are calculated using equations (S18) and (S19) (Supplementary Material online) from 35.5 to 41.5 A-P% for the anterior border, and 41.5–49.5 A-P% for the posterior. The green and blue bars represent the repressive contributions of Gt and Kr, respectively. Results show a decrease in Gt-mediated anterior border repression in mel. In contrast, no change in Kr-mediated posterior border repression was seen. (C) Sum of the total Gt and Kr occupancy at the mel and mel–sim–sec S2E. The height of each colored area is given by the fractional occupancy of individual Gt and Kr binding sites, respectively (supplementary eq. S3, Supplementary Material online). Results show an increase in the total amount of bound Kr in mel. (D) Binding site predictions and their estimated affinities (supplementary eq. S2, Supplementary Material online) in mel and mel–sim–sec S2E. Arrows indicate binding sites that have changed between mel and mel–sim–sec. Binding sites are color coded by their binding affinity according to the color bar below the graph. (E) Shown are the total Bcd and Hb activation versus Gt repression for mel, sec, sim–sec, and mel–sim–sec. The graph shows that total activation changes in tandem with Gt repression.
F<sc>ig</sc>. 6.
Fig. 6.
Functional analysis of homologous S2E sequences shows compensatory evolution between Bcd, Gt, and Kr activities. (Top) Gt repression contribution versus Bicoid activation. (Bottom) Kr repression contribution versus Bicoid activation. Activation and repression contributions are calculated as described in figure 5. Dashed lines correspond to a linear regression fit of the repressive contribution as a function of Bcd activation. Each dot corresponds to a homologous S2E sequence. The 13 homologous S2E sequences tested correspond to the following Drosophila species: Drosophila species: melanogaster (mel), simulans (sim), sechellia (sec), erecta (ere), yakuba (yak), eugracilis (eug), takahashii (tak), kikkawai (kik), mojavensis (moj), grimshawi (gri), ficusphila (fic), picticornis (pic), and pseudoobscura (pse).
F<sc>ig</sc>. 7.
Fig. 7.
Functional analysis of homologous S2E sequences shows no correlation between Hb, Gt, and Kr activities. Hb activation is calculated at the anterior of stripe 2. (Top) Gt repression contribution versus Hb activation. (Bottom) Kr repression contributions versus Bicoid activation. Activation and repression contributions are calculated as in figure 5. The homologous S2E sequences tested are the same as in figure 6.

Similar articles

Cited by

References

    1. Arnosti DN, Gray S, Barolo S, Zhou J, Levine M. The gap protein Knirps mediates both quenching and direct repression in the Drosophila embryo. EMBO J. 1996;15:3659–3666. - PMC - PubMed
    1. Bailey TL, Williams N, Misleh C, Li WW. MEME: discovering and analyzing DNA and protein sequence motifs. Nucleic Acids Res. 2006;34:369–373. - PMC - PubMed
    1. Bateman JR, Lee AM, Wu CT. Site-specific transformation of Drosophila via phi c31 integrase-mediated cassette exchange. Genetics. 2006;173:769–777. - PMC - PubMed
    1. Berg G, von Hippel PH. Selection of DNA binding sites by regulatory proteins. Statistical-mechanical theory and application to operators and promoters. J Mol Biol. 1987;193:723–750. - PubMed
    1. Berman BP, Pfeiffer BD, Laverty TR, Salzberg SL, Rubin GM, Eisen MB, Celniker SE. Computational identification of developmental enhancers: conservation and function of transcription factor binding-site clusters in Drosophila melanogaster and Drosophila pseudoobscura. Genome Biol. 2004;5:R61. - PMC - PubMed

Publication types