

Analysis of synaptic gene expression in the neocortex of primates reveals evolutionary changes in glutamatergic neurotransmission
- PMID: 24408959
- PMCID: PMC4428301
- DOI: 10.1093/cercor/bht354
Analysis of synaptic gene expression in the neocortex of primates reveals evolutionary changes in glutamatergic neurotransmission
Abstract
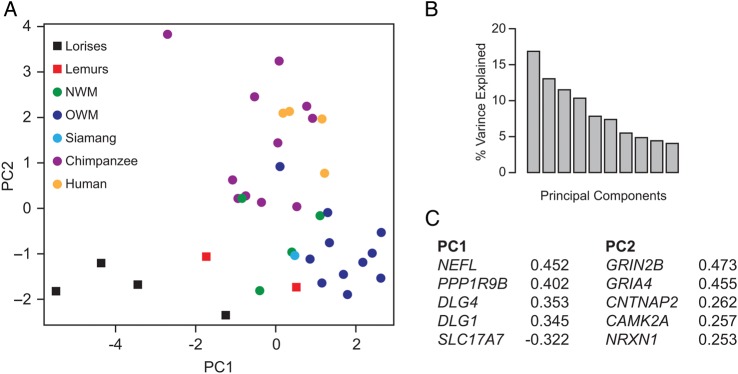
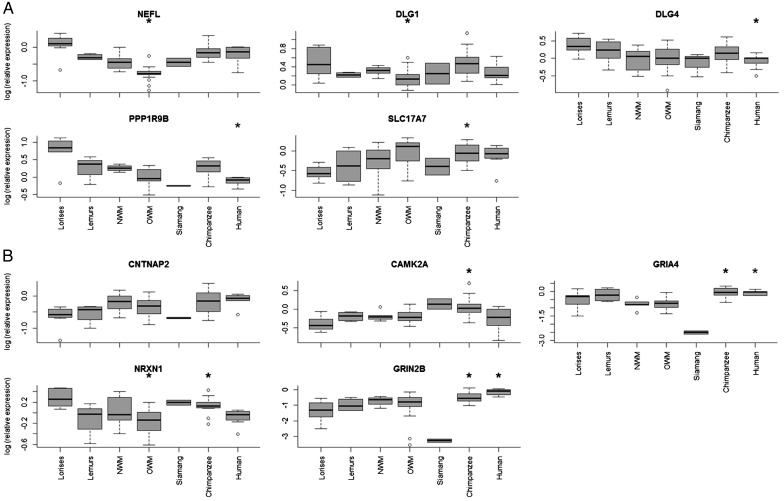
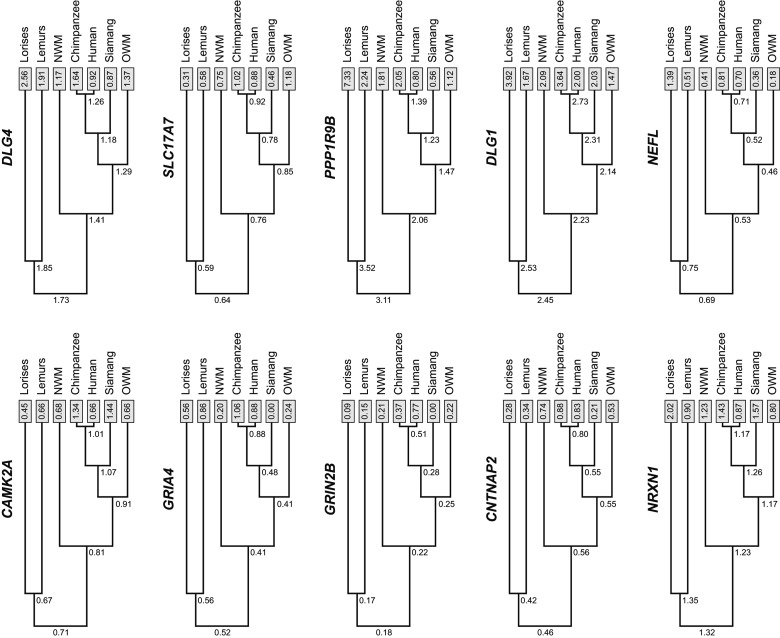
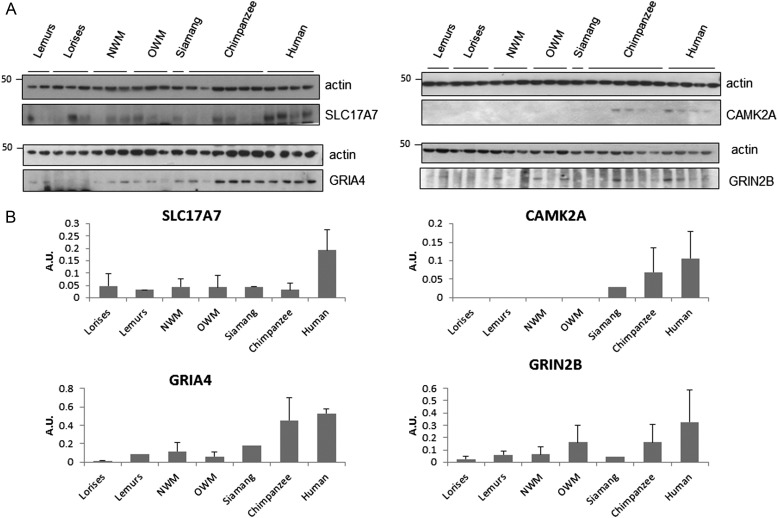
Increased relative brain size characterizes the evolution of primates, suggesting that enhanced cognition plays an important part in the behavioral adaptations of this mammalian order. In addition to changes in brain anatomy, cognition can also be regulated by molecular changes that alter synaptic function, but little is known about modifications of synapses in primate brain evolution. The aim of the current study was to investigate the expression patterns and evolution of 20 synaptic genes from the prefrontal cortex of 12 primate species. The genes investigated included glutamate receptors, scaffolding proteins, synaptic vesicle components, as well as factors involved in synaptic vesicle release and structural components of the nervous system. Our analyses revealed that there have been significant changes during primate brain evolution in the components of the glutamatergic signaling pathway in terms of gene expression, protein expression, and promoter sequence changes. These results could entail functional modifications in the regulation of specific genes related to processes underlying learning and memory.
Keywords: brain evolution; glutamatergic neurotransmission; prefrontal cortex; synapse.
© The Author 2014. Published by Oxford University Press. All rights reserved. For Permissions, please e-mail: journals.permissions@oup.com.
Figures
Similar articles
-
Developmental genetic profiles of glutamate receptor system, neuromodulator system, protector of normal tissue and mitochondria, and reelin in marmoset cortex: potential molecular mechanisms of pruning phase of spines in primate synaptic formation process during the end of infancy and prepuberty (II).Biochem Biophys Res Commun. 2014 Feb 14;444(3):307-10. doi: 10.1016/j.bbrc.2014.01.023. Epub 2014 Jan 16. Biochem Biophys Res Commun. 2014. PMID: 24440696
-
Multiple roles for mammalian target of rapamycin signaling in both glutamatergic and GABAergic synaptic transmission.J Neurosci. 2012 Aug 15;32(33):11441-52. doi: 10.1523/JNEUROSCI.1283-12.2012. J Neurosci. 2012. PMID: 22895726 Free PMC article.
-
Neurobeachin Regulates Glutamate- and GABA-Receptor Targeting to Synapses via Distinct Pathways.Mol Neurobiol. 2016 May;53(4):2112-23. doi: 10.1007/s12035-015-9164-8. Epub 2015 May 2. Mol Neurobiol. 2016. PMID: 25934101 Free PMC article.
-
Integrating neurotransmission in striatal medium spiny neurons.Adv Exp Med Biol. 2012;970:407-29. doi: 10.1007/978-3-7091-0932-8_18. Adv Exp Med Biol. 2012. PMID: 22351066 Review.
-
The postsynaptic density.Cell Tissue Res. 2006 Nov;326(2):409-22. doi: 10.1007/s00441-006-0274-5. Epub 2006 Jul 25. Cell Tissue Res. 2006. PMID: 16865346 Review.
Cited by
-
Humans and great apes share increased neocortical neuropeptide Y innervation compared to other haplorhine primates.Front Hum Neurosci. 2014 Feb 28;8:101. doi: 10.3389/fnhum.2014.00101. eCollection 2014. Front Hum Neurosci. 2014. PMID: 24616688 Free PMC article.
-
NMDAR Neurotransmission Needed for Persistent Neuronal Firing: Potential Roles in Mental Disorders.Front Psychiatry. 2021 Apr 9;12:654322. doi: 10.3389/fpsyt.2021.654322. eCollection 2021. Front Psychiatry. 2021. PMID: 33897503 Free PMC article. Review.
-
Transgenic Mice Carrying GLUD2 as a Tool for Studying the Expressional and the Functional Adaptation of this Positive Selected Gene in Human Brain Evolution.Neurochem Res. 2019 Jan;44(1):154-169. doi: 10.1007/s11064-018-2546-3. Epub 2018 May 18. Neurochem Res. 2019. PMID: 29777493
-
Glutamate-specific gene linked to human brain evolution enhances synaptic plasticity and cognitive processes.iScience. 2024 Jan 19;27(2):108821. doi: 10.1016/j.isci.2024.108821. eCollection 2024 Feb 16. iScience. 2024. PMID: 38333701 Free PMC article.
-
Studies of aging nonhuman primates illuminate the etiology of early-stage Alzheimer's-like neuropathology: An evolutionary perspective.Am J Primatol. 2021 Nov;83(11):e23254. doi: 10.1002/ajp.23254. Epub 2021 May 7. Am J Primatol. 2021. PMID: 33960505 Free PMC article. Review.
References
-
- Alarcón M, Abrahams BS, Stone JL, Duvall JA, Perederiy JV, Bomar JM, Sebat J, Wigler M, Martin CL, Ledbetter DH, et al. 2008. Linkage, association, and gene-expression analyses identify CNTNAP2 as an autism-susceptibility gene. Am J Hum Genet. 82:150–159. 10.1016/j.ajhg.2007.09.005 - DOI - PMC - PubMed
-
- Arnold C, Matthews LJ, Nunn CL. 2010. The 10kTrees website: a new online resource for primate phylogeny. Evol Anthropol Issues News Rev. 19:114–118. 10.1002/evan.20251 - DOI
-
- Bayés A, Collins MO, Croning MDR, van de Lagemaat LN, Choudhary JS, Grant SGN. 2012. Comparative study of human and mouse postsynaptic proteomes finds high compositional conservation and abundance differences for key synaptic proteins. PloS One. 7:e46683 10.1371/journal.pone.0046683 - DOI - PMC - PubMed
Publication types
MeSH terms
Substances
Grants and funding
LinkOut - more resources
Full Text Sources
Other Literature Sources
Molecular Biology Databases
