Comparative Study
. 2014 Jan 29;55(1):612-24.
doi: 10.1167/iovs.13-12351.

Improving glaucoma detection using spatially correspondent clusters of damage and by combining standard automated perimetry and optical coherence tomography

Affiliations
Comparative Study

Improving glaucoma detection using spatially correspondent clusters of damage and by combining standard automated perimetry and optical coherence tomography

Ali S Raza et al. Invest Ophthalmol Vis Sci. .

Abstract

Purpose: To improve the detection of glaucoma, techniques for assessing local patterns of damage and for combining structure and function were developed.

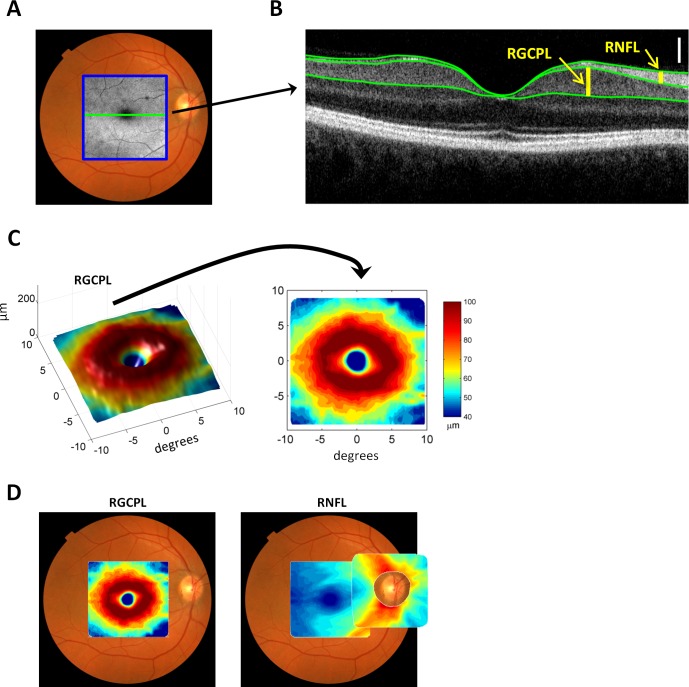
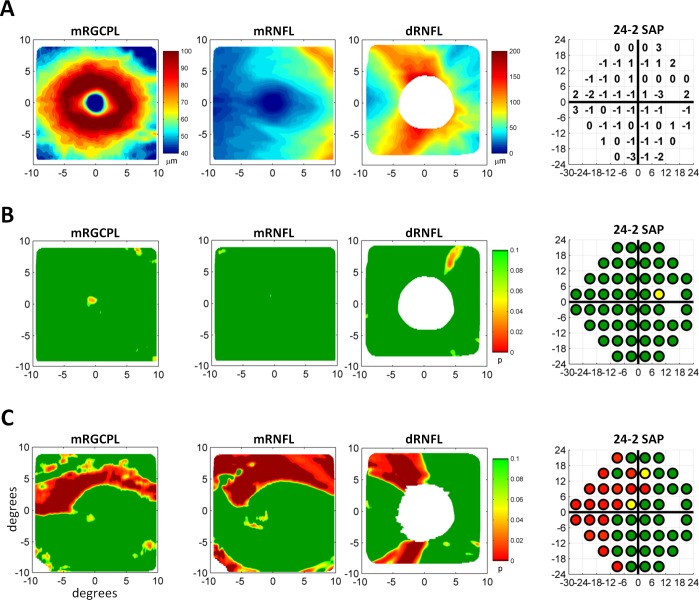
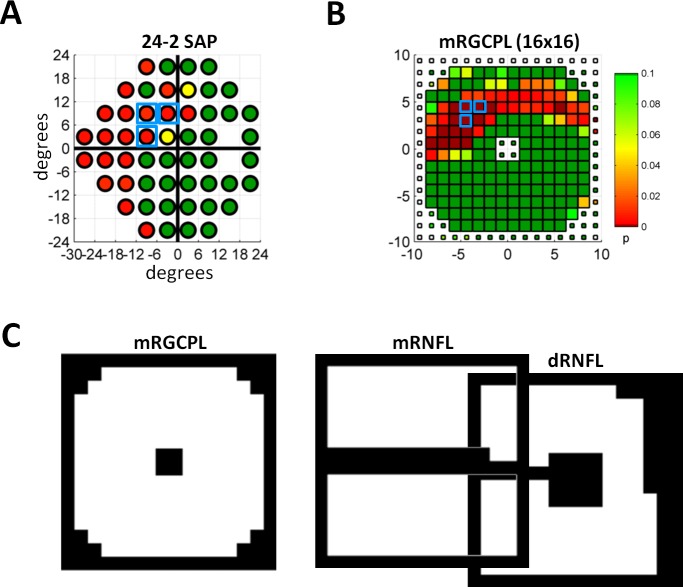
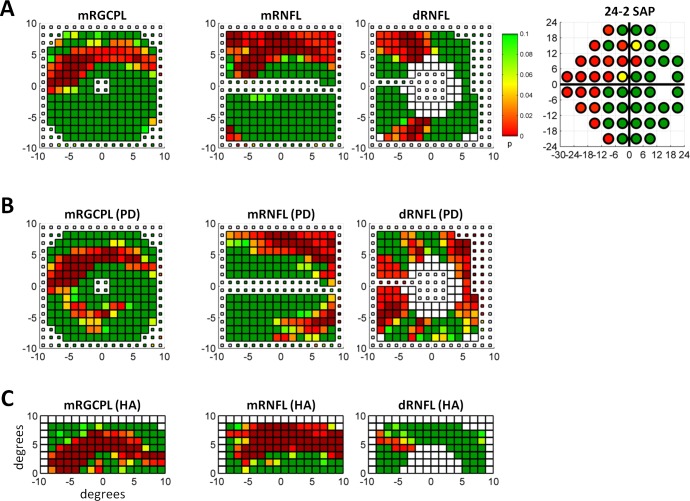
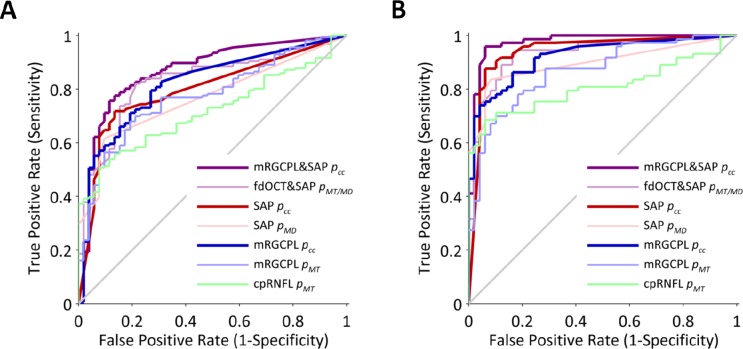
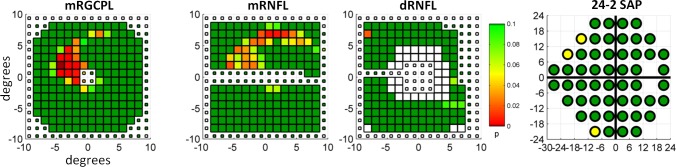
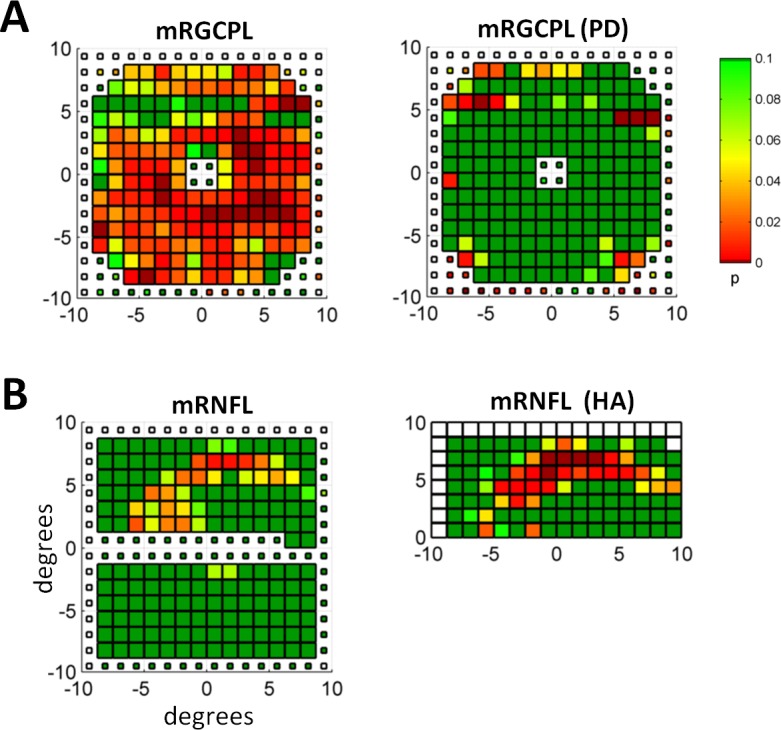
Methods: Standard automated perimetry (SAP) and frequency-domain optical coherence tomography (fdOCT) data, consisting of macular retinal ganglion cell plus inner plexiform layer (mRGCPL) as well as macular and optic disc retinal nerve fiber layer (mRNFL and dRNFL) thicknesses, were collected from 52 eyes of 52 healthy controls and 156 eyes of 96 glaucoma suspects and patients. In addition to generating simple global metrics, SAP and fdOCT data were searched for contiguous clusters of abnormal points and converted to a continuous metric (pcc). The pcc metric, along with simpler methods, was used to combine the information from the SAP and fdOCT. The performance of different methods was assessed using the area under receiver operator characteristic curves (AROC scores).

Results: The pcc metric performed better than simple global measures for both the fdOCT and SAP. The best combined structure-function metric (mRGCPL&SAP pcc, AROC = 0.868 ± 0.032) was better (statistically significant) than the best metrics for independent measures of structure and function. When SAP was used as part of the inclusion and exclusion criteria, AROC scores increased for all metrics, including the best combined structure-function metric (AROC = 0.975 ± 0.014).

Conclusions: A combined structure-function metric improved the detection of glaucomatous eyes. Overall, the primary sources of value-added for glaucoma detection stem from the continuous cluster search (the pcc), the mRGCPL data, and the combination of structure and function.

Keywords: detection; diagnosis; glaucoma; glaucomatous; macula; optical coherence tomography; retinal ganglion cells; retinal nerve fiber layer; sensitivity; specificity; standard automated perimetry; visual fields.


Figures

Figure 1
Figure 1
Measurements from fdOCT. (A) Fundus photo with an en face fdOCT (C-face) intensity image superimposed within a blue square. (B) The central slice through the macula of the fdOCT image (B-scan) corresponding to the horizontal green line in (A). Superimposed green lines mark the boundary between anatomical layers. The thicknesses of the RNFL and RGCPL are shown with yellow vertical bars. The white vertical calibration bar represents 100 μm. (C) The 3-dimensional macular RGCPL thickness (left) and a top-down view (right) with thickness represented in pseudo-color. (D) The macular RGCPL superimposed on a fundus photo (left) and the macular and disc RNFL superimposed on a fundus photo (right).
Figure 2
Figure 2
Measurements from fdOCT and SAP converted to probability values. (A) The mRGCPL as well as the mRNFL and dRNFL thicknesses for a healthy control eye (left three panels). The 24-2 SAP total deviation values for the same eye (right). (B) The data in (A) converted to probability values. (C) Data from a glaucomatous eye in the same format as (B).
Figure 3
Figure 3
Cluster analysis and ROIs. (A) The 24-2 SAP data as in Figure 2C with a set of points meeting the 5-5-1 cluster criterion outlined by light blue boxes. (B) Probability values from mRGCPL thickness data downsampled into a 16 × 16 grid. Data are from the same eye shown in Figure 2C. The small squares indicate values outside the ROI. White squares indicate missing data (which often occurs at scan edges after centering the scan). A set of points meeting the 5-5-1 cluster criterion is outlined by light blue boxes. (C) The ROIs shown in white for the mRGCPL, mRNFL, and dRNFL data. The dRNFL is offset from the mRNFL data based on anatomy, as shown in Figure 1D.,
Figure 4
Figure 4
Sample data from a glaucomatous eye. (A) The downsampled mRGCPL, mRNFL, and dRNFL fdOCT data, as well as the 24-2 SAP data from the same glaucomatous eye shown in Figure 2C. The white squares near the center of the dRNFL data represent data missing due to the optic disc. (B) The fdOCT data after the PD analysis in a similar format as (A). (C) The fdOCT data after the HA analysis in a similar format as (A).
Figure 5
Figure 5
Receiver operator characteristic curves for various metrics. (A) Receiver operator characteristic curves for the entire population. (B) Receiver operator characteristic curves for a subpopulation in which SAP was used as inclusion and exclusion criteria.
Figure 6
Figure 6
Example of an eye, belonging to the glaucomatous group, with a subtle arcuate defect in the macula. Data are in the same form as shown in Figure 4A.
Figure 7
Figure 7
Examples of PD and HA analyses. (A) The mRGCPL probability values based on thickness (left) and the PD analysis (right) for an eye belonging to the healthy control group. (B) The mRNFL probability values based on thickness (left) and the HA analysis (right) for an eye belonging to the glaucomatous group. Same eye as shown in Figure 6.

References

    1. Asman P, Heijl A. Glaucoma hemifield test: automated visual field evaluation. Arch Ophthalmol. 1992; 110: 812–819 - PubMed
    1. Huang D, Swanson EA, Lin CP, et al. Optical coherence tomography. Science. 1991; 254: 1178–1181 - PMC - PubMed
    1. Sharma P, Sample PA, Zangwill LM, Schuman JS. Diagnostic tools for glaucoma detection and management. Surv Ophthalmol. 2008; 53: 17–32 - PMC - PubMed
    1. Chang R, Budenz DL. New developments in optical coherence tomography for glaucoma. Curr Opin Ophthalmol. 2008; 19: 127–135 - PubMed
    1. Wojtkowski M, Fercher AF, Leitgeb R. Phase-sensitive interferometry in optical coherence tomography. Proc SPIE. 2001; 4515: 250–255

Publication types