. 2013 Dec 27:7:262.
doi: 10.3389/fnins.2013.00262. eCollection 2013.

P75 nerve growth factor receptors modulate development of GnRH neurons and olfactory ensheating cells

Affiliations

P75 nerve growth factor receptors modulate development of GnRH neurons and olfactory ensheating cells

Franca Raucci et al. Front Neurosci. .

Abstract

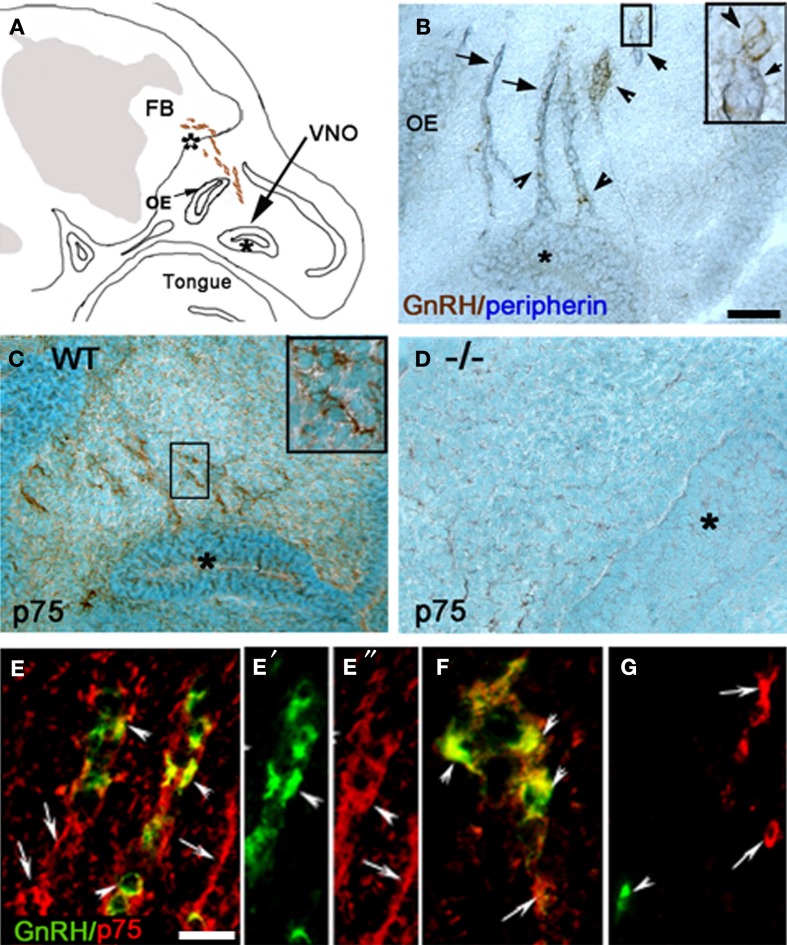
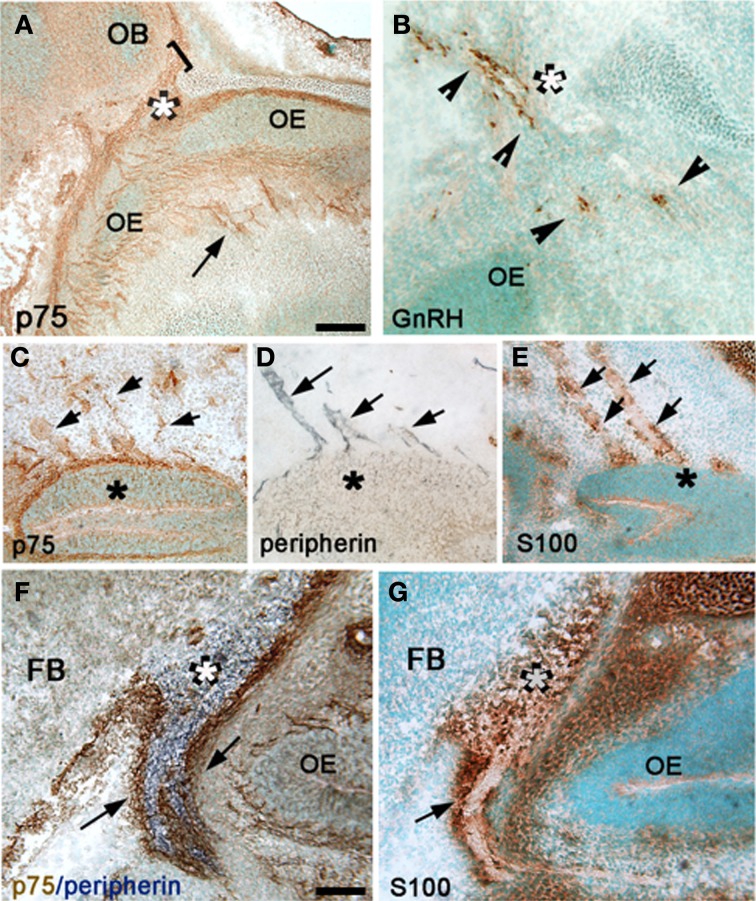
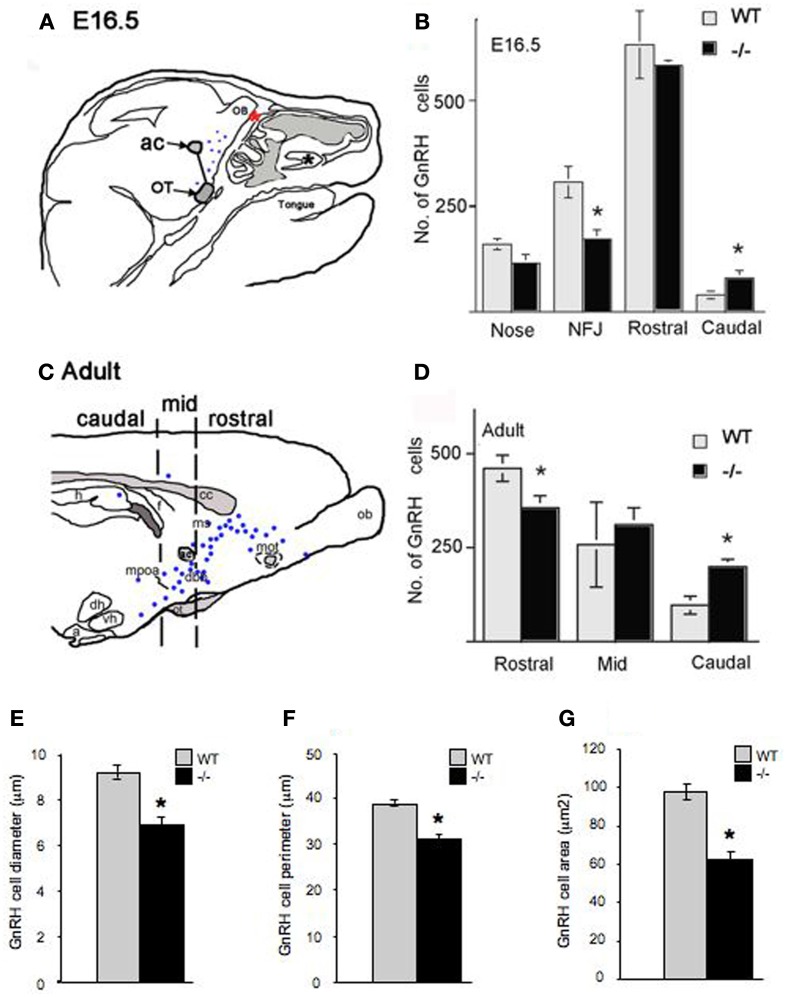
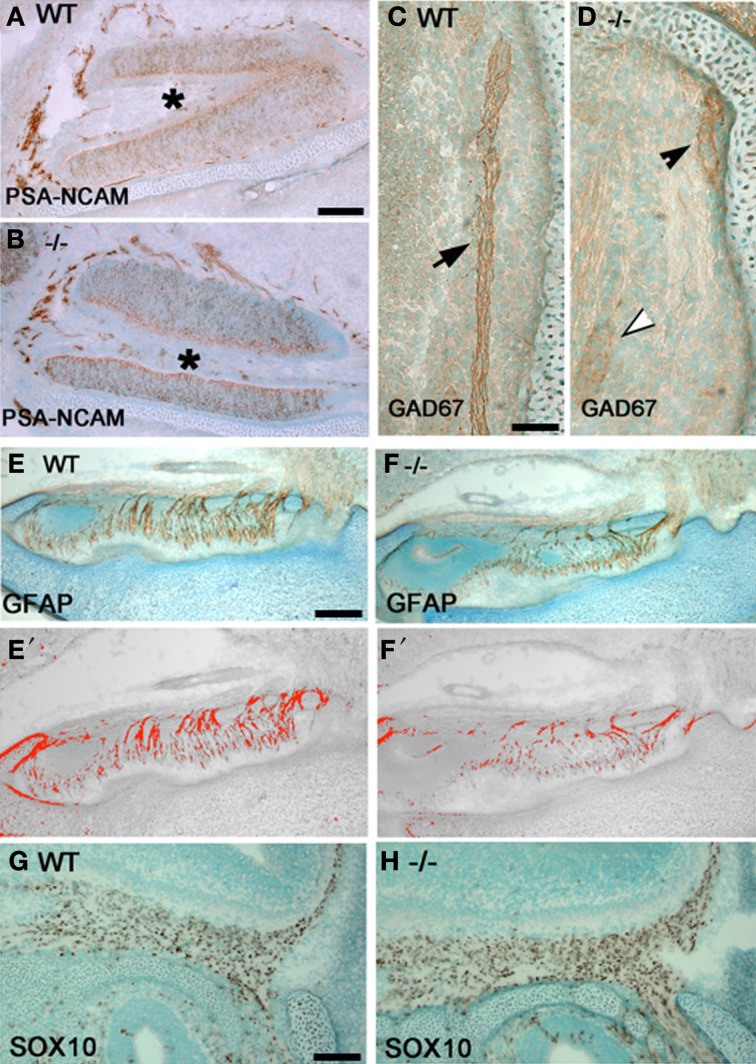
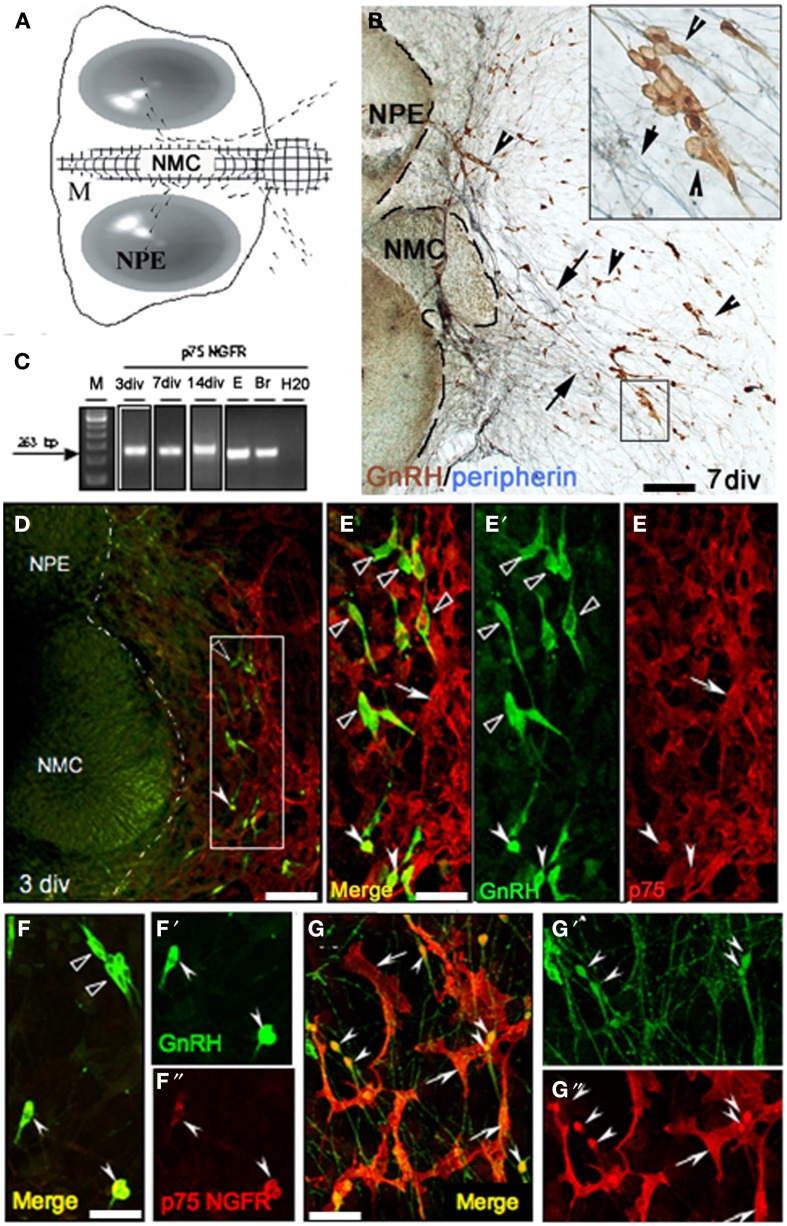
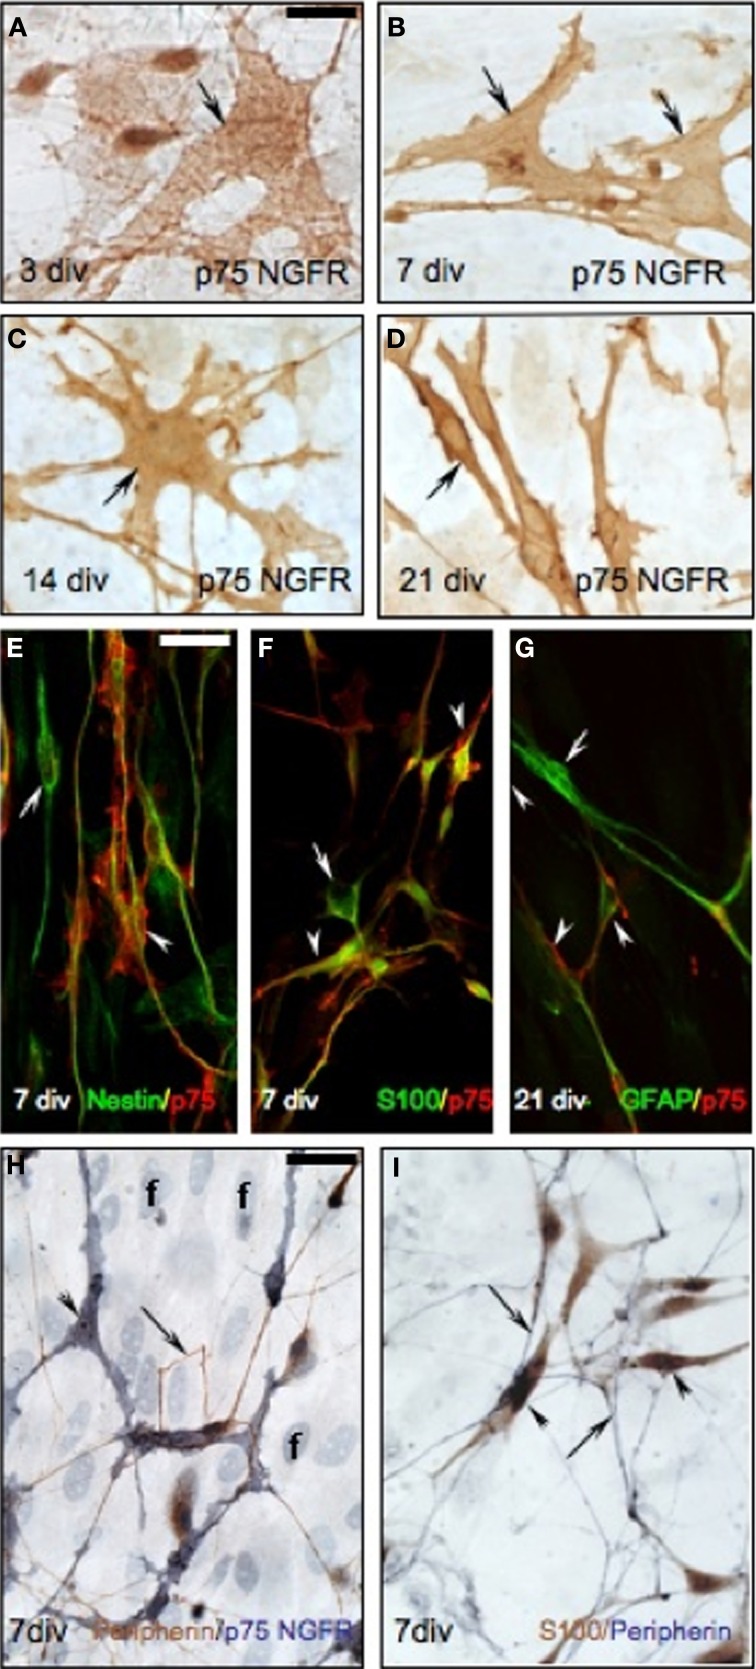
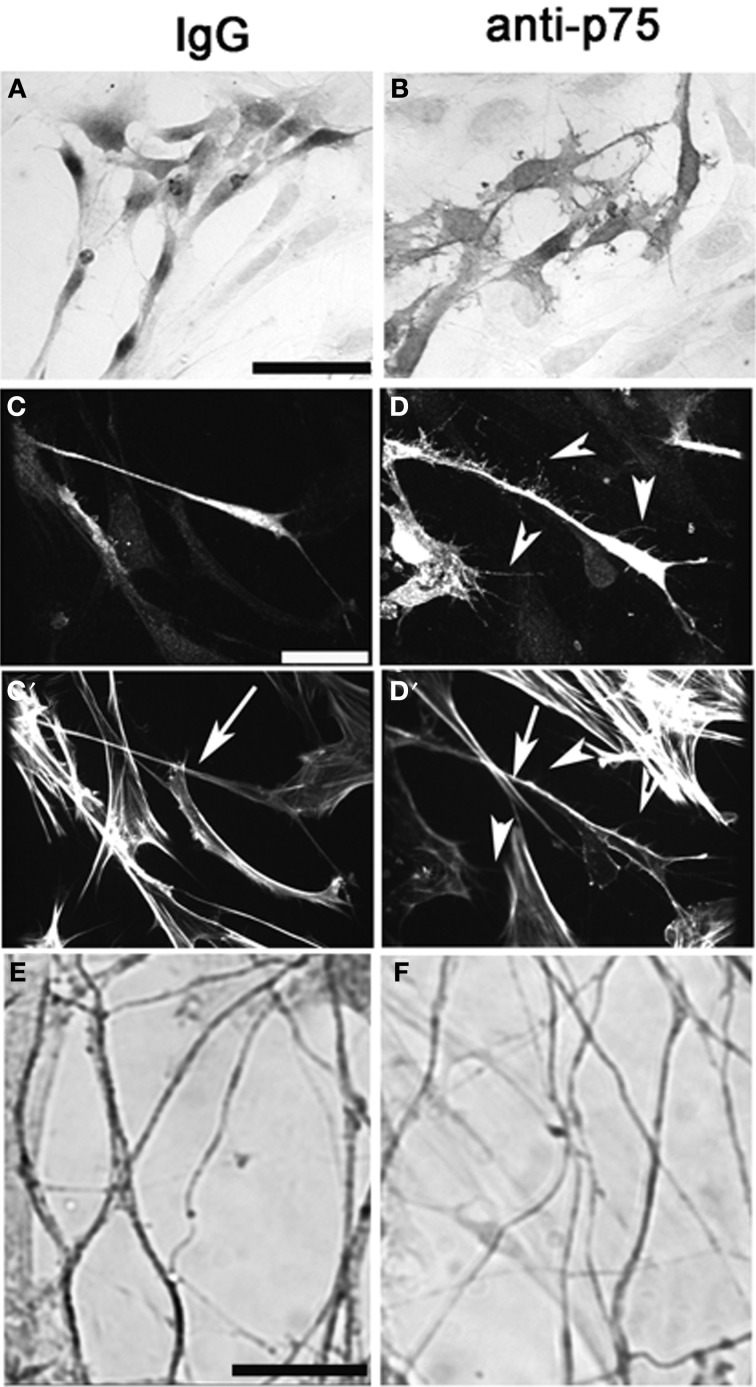
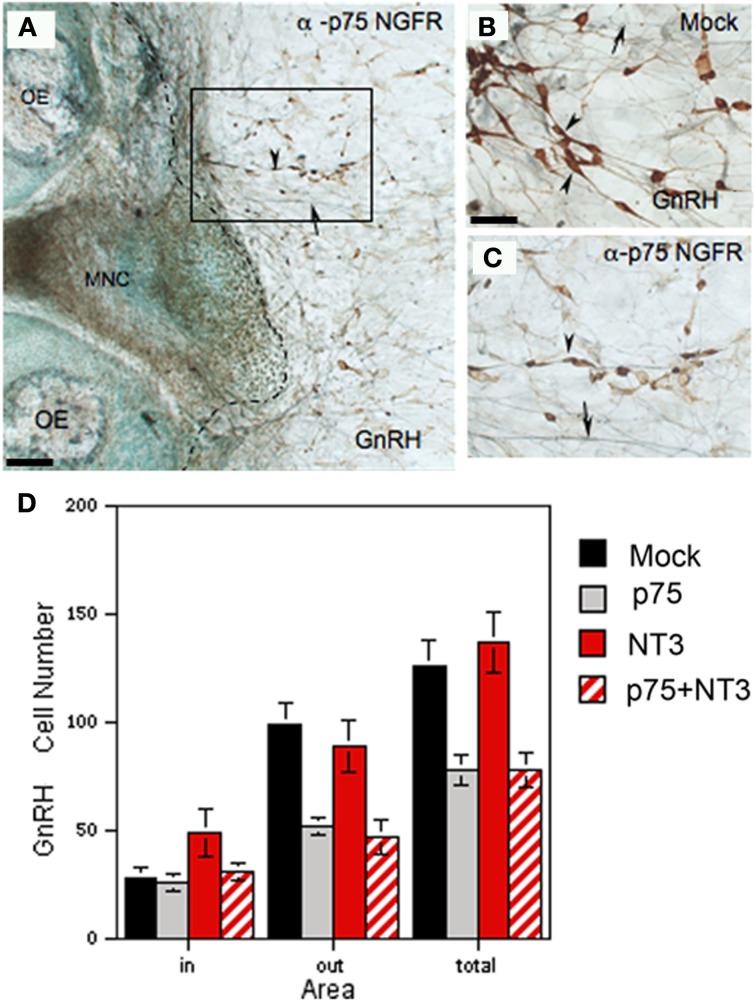
Temporal and spatial localization of nerve growth factor receptor (p75NGFR) in the developing olfactory system and gonadotropin-releasing hormone-1 (GnRH) system was characterized and its role analyzed using p75NGFR null mice and nasal explants. Prenatally, p75NGFR was expressed by GnRH neurons and olfactory ensheathing cells (OECs). In p75NGFR null mice, no change in the number of GnRH cells was detected as compared to wild-type. However, in null mice, a shift in the distribution of GnRH neurons was found, with a small population of GnRH cells migrating further caudally toward the median eminence. Additionally, a reduction of both GAD67 positive olfactory axons and GFAP positive OEC fibers occurred. Acute administration of a p75NGFR blocker to GnRH cells maintained in vitro increased migration rate, consistent with the change in distribution detected in p75NGFR null mice. Chronic inhibition of p75NGFR caused an attenuation of olfactory axon fasciculation and a decrease in OEC density, again mimicking the changes detected in null mice. However, a reduction in GnRH cell number was found after chronic treatment that not observed in KO animals suggesting indirect changes occur during chronic treatment in vitro and/or a compensatory mechanism occurs in vivo that prevents loss of GnRH neurons in the absence of p75NGFR.

Keywords: LHRH neurons; development; migration; olfactory ensheathing cells; olfactory system.


Figures

Figure 1
Figure 1
GnRH neurons express p75NGFR. (A) Camera lucida drawing of an E12.5–E14.5 mouse head showing the localization of GnRH neurons (brown dots) in the nasal region. (B) Sagittal section from an E12.5 mouse immunostained for GnRH (brown, arrowhead) and peripherin (blue, arrow; insert = higher magnification of boxed region). Both cells and fibers are detected leaving the vomeronasal organ (VNO, marked by asterisk). (C) Immunostaining for p75NGFR (p75, brown) spatially overlapped with GnRH neurons and olfactory fiber tracks/pathways. (D) Sagittal section from an E16.5 p75NGFR mutant embryo (−/−) stained with the p75NGFR antibody. No p75NGFR staining was observed. (E–E″) Double-labeling for GnRH (green) and p75NGFR (red) showed that the majority of migrating GnRH neurons emerging from the VNO co-expressed the receptor (arrowheads), but p75NGFR immunoreactivity was also localized to structures other than GnRH cells (arrows). (F) Double-labeling for GnRH (green) and p75NGFR (red) showed that the majority of GnRH cells were still p75NGFR positive (arrowheads) at the nasal-forebrain junction; some p75NGFR immunopositive/GnRH negative elements were also present (arrows). (G) Adult mouse brain (hypothalamic area) stained for GnRH (green) and p75NGFR (red). GnRH positive cells (arrowhead) did not colocalize with p75NGFR, although p75NGFR positive cells were present in nearby areas (arrows). OE = Olfactory epithelium, FB = forebrain; white asterisk = nasal forebrain junction. Scale bars: (B–D) = 250 μm; (E–G) = 25 μm.
Figure 2
Figure 2
P75NGFR cells are associated with the developing olfactory system—OECs. (A,B) Comparison of p75NGFR staining (A, p75) and GnRH staining (B) indicated that more structures express p75NGFR than just the GnRH cells. p75NGFR staining (A) highlighted track-like structures in the nose (arrow) around the OE and crossing through the nasal mesenchyme, as well as at the nasal/forebrain junction (white asterisk) extending into the developing olfactory bulb (OB, bracket). At this development stage, GnRH neurons (B, arrowheads) cross the nasal/forebrain junction (white asterisk) and turn caudal into the FB. (C–E) Sagittal sections of the nasal region stained for p75NGFR (C), peripherin (D), and S100 (E) indicate that both p75NGFR- and S100-positive elements are distributed along olfactory axons (expressing peripherin) extending from the VNO (asterisk). At this developmental stage S100 is a marker for OECs. (F) Double immunocytochemistry for p75NGFR (brown) and peripherin (blue) revealed p75NGFR immunopositive cells (arrows) at the nasal forebrain junction (white asterisk) that apposed peripherin positive olfactory axons (blue). Note p75NGFR and peripherin did not colocalize in olfactory fibers. (G) Serial consecutive section to that in (F), immunostained for S100 (brown, arrow) showing robust labeling in a pattern similar to that of p75NGFR (compare F and G). Scale bars: (A–E) = 250 μm; (F,G) = 50 μm.
Figure 3
Figure 3
Altered morphology and distribution of GnRH neurons in p75NGFRmutant (-/-) embryos. At E16.5, the majority of GnRH neurons have migrated into the forebrain associated with a subpopulation of olfactory axons. (A) Camera lucida of E16.5 sagittal head showing nasal forebrain junction (red asterisk) and location of anterior commissure (ac) and optic tract (OT) that were used as markers, from which a diagonal line was drawn separating rostral from caudal GnRH cell population. GnRH cells were found in the nasal area [between the VNO (black asterisk) and nasal forebrain junction (NFJ, red asterisk)], at the NFJ, and within the forebrain (black dots). (B) Histogram showing distribution of GnRH cells in the nasal and brain regions at E16.5, a decrease in the number of GnRH cells in the NFJ with a corresponding increase in the caudal cell population is observed in -/- mice. (C) Camera lucida of adult brain showing location of markers for rostral = before anterior commissure (ac), medial = between ac and before suporaoptic nucleus, Blue dots = location of GnRH cells, and caudal = from supraoptic nucleus to caudal brain areas. (D) In the adult, a decrease in the GnRH population within the rostral brain region with corresponding increase in caudal brain was observed. Measurements of GnRH cell diameter (E), perimeter (F) and area (G) revealed a significant reduction in all three parameters in p75NGFR−/−embryos. *p < 0.001.
Figure 4
Figure 4
Olfactory fiber and OECs changes in p75NGFR−/− mice. Sagittal sections close to midline of a p75NGFR−/− (B,D,F,H) embryo and WT littermates (A,C,E,G) showing an area of VNO (A,B) and nasal forebrain junction (C,D,E–H). Sections were immunostained for markers of olfactory axons—PSA-NCAM (A,B) and GAD67 (C,D), and for OECs—GFAP (E,F) and SOX10 (G,H). (E′–F′) are representative transformed images corresponding to (E) and (F), respectively, and were used for measurement of olfactory fiber density; similarly transformed images (not shown) were used in optical density measurement for Sox10 positive cells in (G) and (H). Optical density values from structures other than the fibers were subtracted from the total measurements. (A,B) PSA-NCAM-immuostained fibers around the VNO have similar pattern and intensity between WT (A) and -/- (B) animals. (C,D) GAD67 staining intensity in WT control animals is strong (C, brown, arrow); whereas, variable staining pattern observed in−/− mice (D), from weak (white arrowhead), moderate (black arrowhead) to absent. (E,F) Optical density measurement of GFAP-positive fibers in NFJ showed significant reduction in fiber density of p75−/− mice compared to its WT littermates. (G,H) Optical density measurement of OECs in the NFJ showed increase in staining intensity in -/- mice but cell counts were similar with WT animals. Scale bars: 250 μm.
Figure 5
Figure 5
P75NGFR expression in nasal explants mimics expression in vivo. (A) Schematic of nasal explant showing the migration of GnRH neurons (black dots) across the main tissue mass (M) from the nasal pit/epithelial region (NPE) to the nasal midline cartilage (NMC), and then into the periphery of the explant. (B) Double immunocytochemistry showing GnRH neurons (brown, arrowheads) and peripherin fibers (blue, arrows) on a 7 div nasal explant. At this stage the majority of GnRH neurons have migrated off the main tissue mass into the periphery along peripherin-immunoreactive axons (see insert). (C) Gel documentation of PCR products using specific primers for p75NGFR on single GnRH cell at 3, 7, 14 div, E17.5 head (E) and adult brain (Br). A band of expected size (263 bp) was detected in GnRH cells in nasal explants at all 3 ages. No band was detected in water. (D,E) Double immunofluorescence using antibodies against GnRH (green) and p75NGFR (red) at 3div showed that the majority of GnRH neurons localized proximal to the main tissue mass did not express p75NGFR (E–E″ = high magnification of box area in D, black arrowheads); however, p75NGFR immunoreactivity was detected in some GnRH neurons (E–E″, white arrowheads) and in a multipolar phenotype also out in the periphery of the explant (arrows, E–E′, dashed line in D indicates the border between the tissue mass and the periphery). (F–G″) At 7 div GnRH neurons (green) in the proximal aspect of the periphery of the explant (close to the main tissue mass, F–F″) were either p75NGFR negative (black arrowheads), or showed co-expression of p75NGFR protein (white arrowheads). Distally (G–G″), the expression of p75NGFR in migrating GnRH neurons increased as function of distance from the tissue mass/into the periphery (arrowheads). Note, p75NGFR multipolar positive elements (arrows) were closely associated with both soma and fibers of GnRH neurons. Scale bars: (B,D) = 250 μm; (E–G″) = 50 μm.
Figure 6
Figure 6
Characterization of p75NGFR positive OECs in nasal explants. (A–D) p75NGFR-immunoreactive cells (brown, arrows) in the periphery of nasal explant undergo morphological changes, increasing process extensions between 3 (A), 7 (B), and 14 (C) div, and changing from multipolar to bipolar between 14 (C) and 21 (D) div. (E) Double-immunofluorescence using nestin (green) and p75NGFR (red) antibodies at 7 div showed a subpopulation of p75NGFR-positive multipolar cells (arrowhead) coexpressed nestin, an early neural marker. Some nestin-positive/p75NGFR-negative cells were also evident (arrow). (F) Double-label immunofluorescence colocalized S100 (OEC marker, green) and p75NGFR (red) at 7 div (arrowheads). Some S100-positive/p75NGFR-negative elements (F, arrow) were also detected in the periphery of the explant. (G) Double-label fluorescence at 21 div showed a subpopulation of p75NGFR-positive cells (red) expressed GFAP (OEC marker, arrowhead). Some GFAP-positive/p75NGFR- negative cells were also present (G, arrow). Note, in all double- immunofluorescence images (E–G) p75NGFR reactivity appeared localized to the surface of the cell membrane. (H) Double-immunostaining for peripherin (brown, arrows) and p75NGFR (blue, arrowheads) at 7 div. In the periphery of the explant, peripherin-positive axons (arrows) were closely associated with p75NGFR multipolar-positive OECs cells (arrowheads). In fact, the olfactory axons appeared to preferentially grow to p75NGFR OECs. (I) Double-immunocytochemistry against the OEC marker, S100 (brown, arrowheads) and peripherin (blue, arrows) at 7 div showed a similar pattern to that in panel (H). Scale bars: = 250 μm.
Figure 7
Figure 7
Perturbation of p75NGFR signaling in vitro alters morphology of OECs and causes defasciculation of olfactory fibers. Nasal explants at 6div following treatment with p75NGFR blocking antibody (1:6000, B,D,F) and with rabbit IgG mock, 1:6000, (A,C), Explants were immunocytochemically-stained for S-100 (A,B), S-100 and Phalloidin (C,D) or peripherin (E,F). (A–D) Disruption of p75NGFR signaling alters morphology of OECs The morphology of S100-positive cells located distal to the explant's tissue mass were larger, flatter, and exhibit more processes and neurites (B,D) as compared to control group (A,C). Staining for actin (phalloidin) revealed that these processes had sparse actin filaments (D′, arrowheads). OECs in the treated group also appeared to have denser cortical actin along the axis of the cell body (C′ vs. D′, arrow). Finally, disruption of p75NGFR increased olfactory fiber branching and decreased the optical density of peripherin-positive fibers, suggesting defasciculation had occurred. Scale bars: = 250 μm.
Figure 8
Figure 8
Neutralization of endogenous p75NGFR decreases GnRH cell number. (A–C) Nasal explants immunocytochemically stained for GnRH (brown, arrowheads) and peripherin (blue, arrows) at 6div after blocking antibody treatment (A,C; α-p75 NGFR) and in control condition (B, mock: rabbit IgG, 1:6000). Inhibition of p75 NGFR appeared to decrease the number of GnRH neurons in the periphery (C, arrowheads) as compared to the mock (B), arrowheads, the dashed line in (A) indicates the border of the explant tissue mass. (D) Histogram showing the mean cell number of GnRH neurons detected in the tissue (in), in the periphery of explant (out) and the total number (total) in 4 treatment groups: control (mock, black), anti-p75NGFR (gray bars), NT-3 (red bars) and anti-p75NGFR+NT-3 (red hatched bars). Anti-p75NGFR ± NT-3 treatment significantly decreased the number of GnRH cells in the periphery (out) and total number of GnRH neurons (total) in comparison with the control and NT-3 treated groups (p < 0.001). No differences were found in the number of GnRH cells on the main tissue mass (in). Scale bars: (A) = 250 μm; (B,C) = 50 μm.

Similar articles

Cited by

References

    1. Anton E. S., Weskamp G., Reichardt L. F., Matthew W. (1994). Nerve growth factor and its low-affinity receptor promote Schwann cell migration. Proc. Natl. Acad. Sci. U.S.A. 91, 2795–2799 10.1073/pnas.91.7.2795 - DOI - PMC - PubMed
    1. Arevalo J. C., Wu S. H. (2006). Neurothrophin signaling: many exciting surprises! Cell. Mol. Life Sci. 63, 1523–1537 10.1007/s00018-006-6010-1 - DOI - PMC - PubMed
    1. Barrett G. L., Bartlett P. F. (1994). The p75 NGF receptor mediates survival or death depending on the stage of sensory neuron development. Proc. Natl. Acad. Sci. U.S.A. 91, 6501–6505 10.1073/pnas.91.14.6501 - DOI - PMC - PubMed
    1. Bentley C. A., Lee K. F. (2000). p75 is important for axon outgrowth and Schwann cell migration during development. J. Neurosci. 20, 7706–7715 - PMC - PubMed
    1. Bergmann I., Priestley J. V., McMahon S. B., Brocker E.-B., Toyka K. V., Koltzenburg M. (1997). Analysis of cutaneous sensory neurons in transgenic mice lacking the low affinity neurotrophin receptor p75. Eur. J. Neurosci. 9, 18–28 10.1111/j.1460-9568.1997.tb01349.x - DOI - PubMed

LinkOut - more resources