. 2014 Jan 8:7:53.
doi: 10.3389/fnana.2013.00053. eCollection 2014.

Perineuronal nets and GABAergic cells in the inferior colliculus of guinea pigs

Affiliations

Perineuronal nets and GABAergic cells in the inferior colliculus of guinea pigs

Nichole L Foster et al. Front Neuroanat. .

Abstract

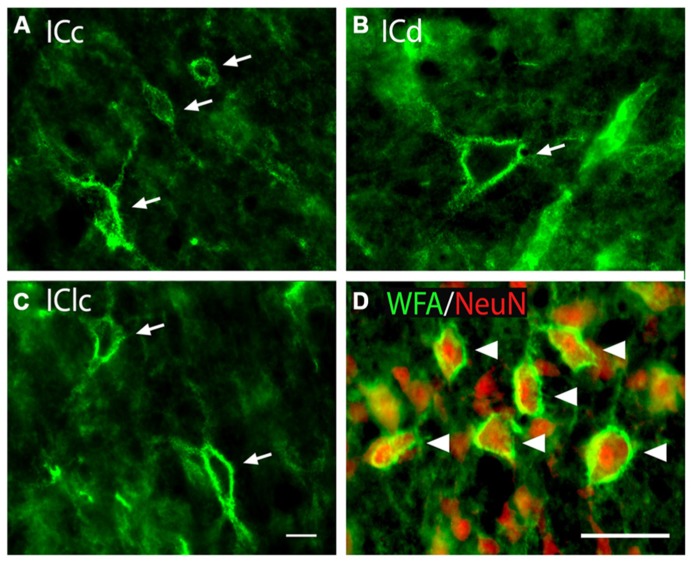
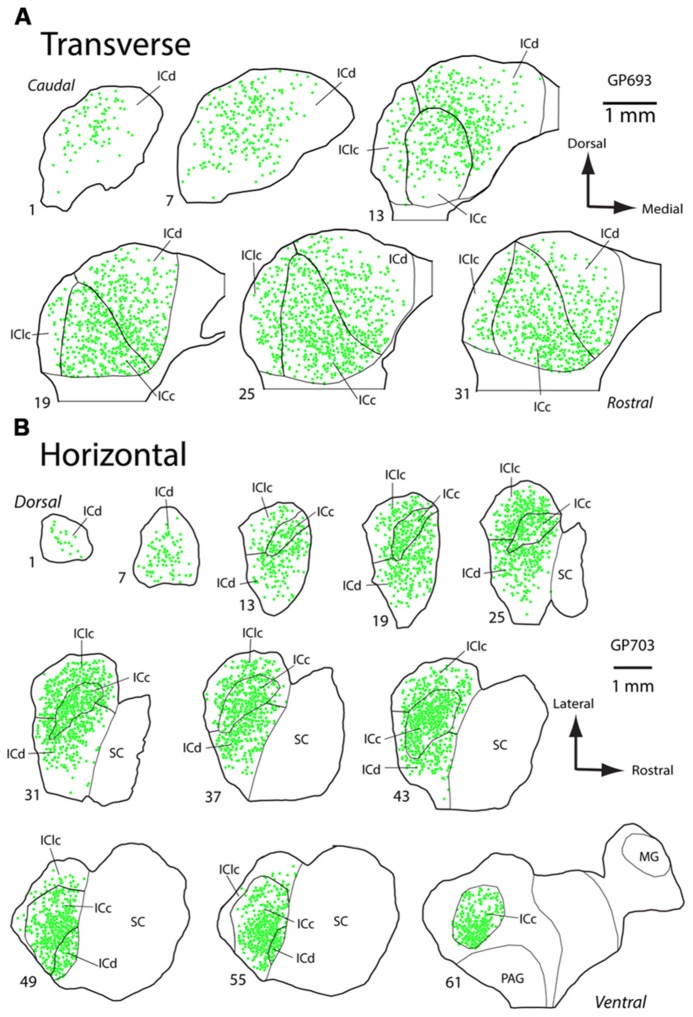
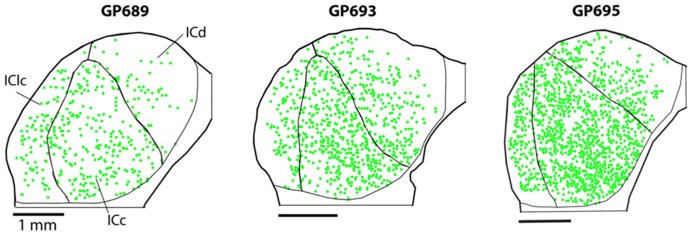
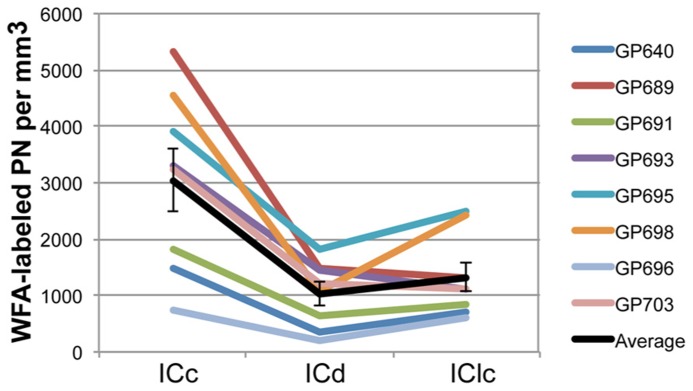
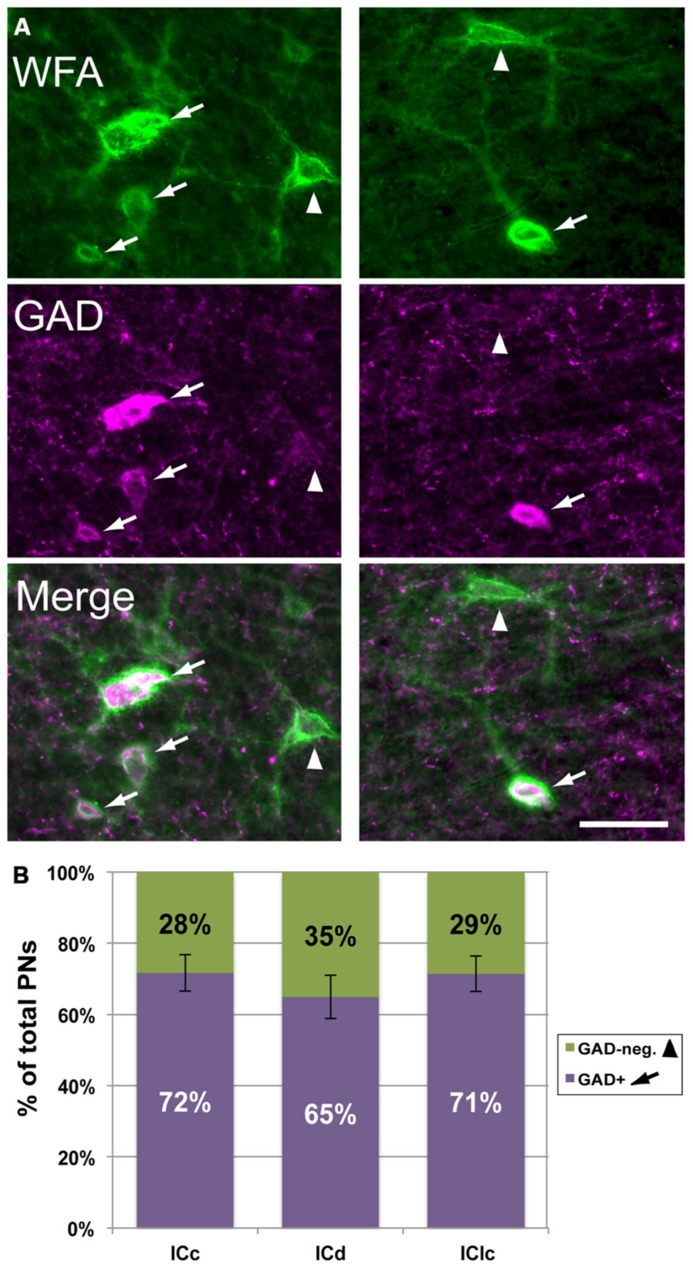
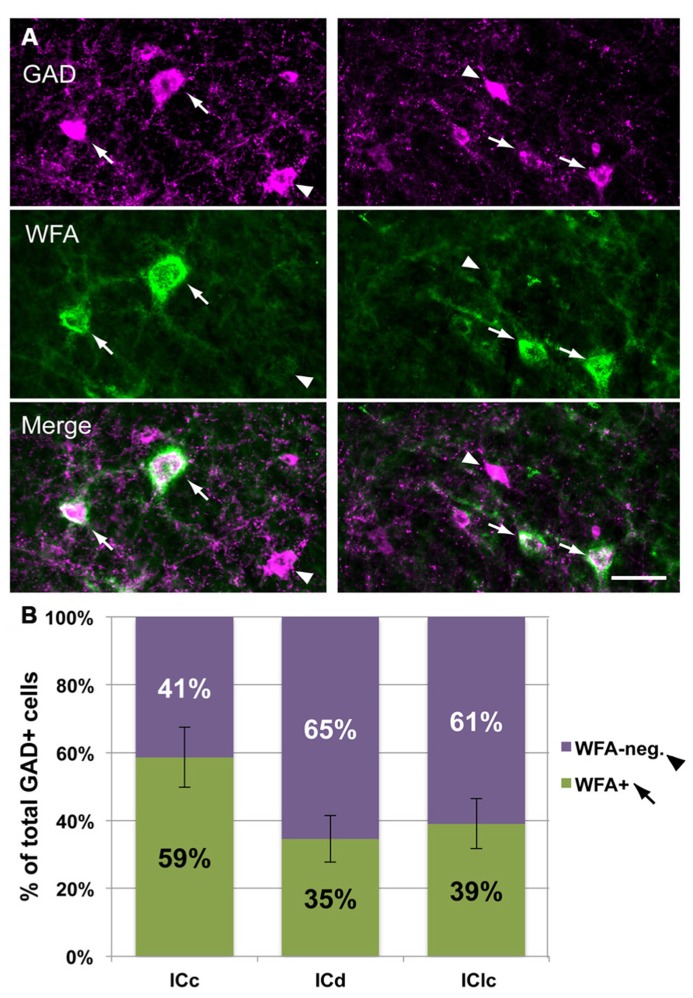
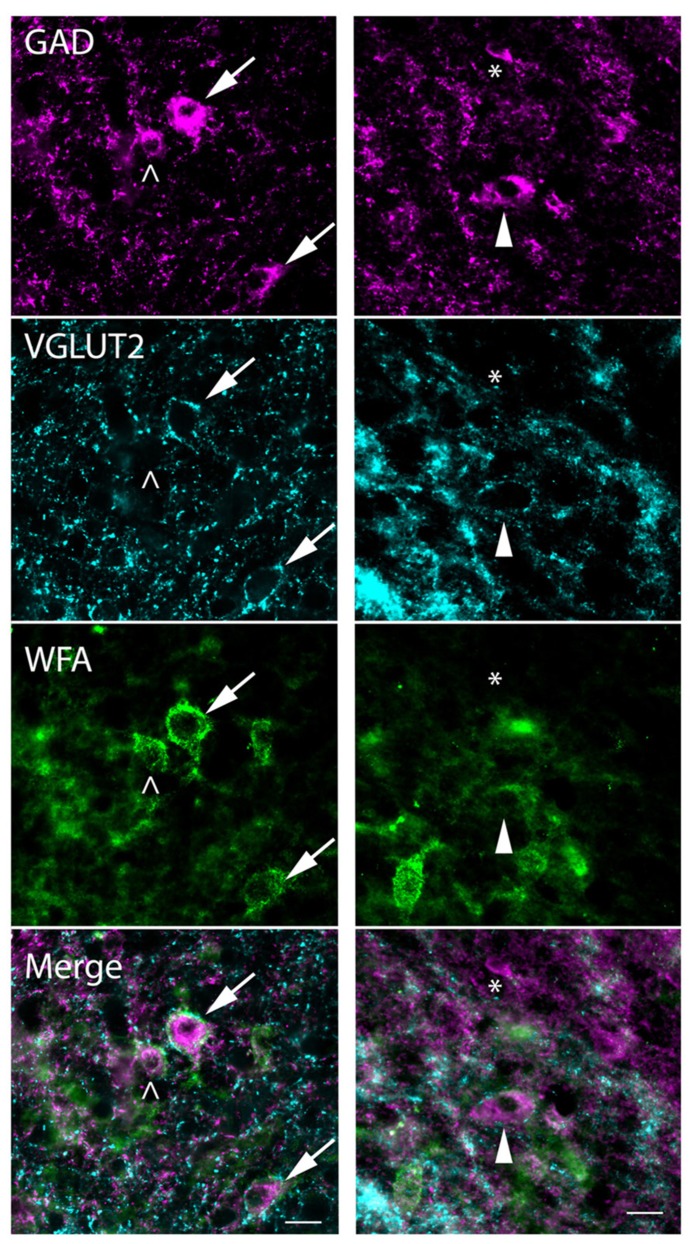
Perineuronal nets (PNs) are aggregates of extracellular matrix that have been associated with neuronal plasticity, critical periods, fast-spiking cells and protection from oxidative stress. Although PNs have been reported in the auditory system in several species, there is disagreement about the distribution of PNs within the inferior colliculus (IC), an important auditory hub in the midbrain. Furthermore, PNs in many brain areas are preferentially associated with GABAergic cells, but whether such an association exists in the IC has not been addressed. We used Wisteria floribunda agglutinin staining and immunohistochemistry in guinea pigs to examine PNs within the IC. PNs are present in all IC subdivisions and are densest in the central portions of the IC. Throughout the IC, PNs are preferentially associated with GABAergic cells. Not all GABAergic cells are surrounded by PNs, so the presence of PNs can be used to subdivide IC GABAergic cells into "netted" and "non-netted" categories. Finally, PNs in the IC, like those in other brain areas, display molecular heterogeneity that suggests a multitude of functions.

Keywords: GABA; auditory; extracellular matrix; inhibition; midbrain; plasticity.


Figures

FIGURE 1
FIGURE 1
Photomicrographs of PNs (arrows) in the IC (A–C). WFA-labeled PNs in each IC subdivision showing similarity of nets across subdivisions as well as variation in staining intensity, size, and morphology. GP696. Scale bar = 20 μm. (D) WFA and anti-NeuN staining in the ICc. Arrowheads indicate WFA-labeled PNs (green) around neurons stained with the neuron-specific marker NeuN (red). ICc, ICd, IClc: inferior colliculus central nucleus, dorsal cortex, and lateral cortex, respectively. GP710. Scale bar = 50 μm.
FIGURE 2
FIGURE 2
Plots of WFA-labeled PNs in the inferior colliculus (IC). (A) Plot showing the distribution of WFA-labeled PNs (green circles) in transverse sections through the IC. Sections progress from caudal to rostral. Medial is right, dorsal is up. Scale bar = 1 mm. Case GP693. (B) Plot showing distribution of WFA-labeled PNs (green circles) in horizontal sections through the IC. Sections progress from dorsal to ventral. Rostral is right, lateral is up. Scale bar = 1 mm. Case GP703.
FIGURE 3
FIGURE 3
Plots of WFA-labeled PNs (green circles) showing the variation in PN density across three cases. In each case, the average PN density is highest in the ICc, but the absolute density of PNs varies, ranging from low density in case GP689, to intermediate level in case GP693, and high density in case GP695. Transverse plane; medial is right, dorsal is up. Scale bars = 1 mm.
FIGURE 4
FIGURE 4
Graph of PN density in each IC subdivision in eight animals. The values across subdivisions are connected for each individual case to facilitate comparisons between the cases; note that in all cases the ICc has the highest density of PNs. Black line indicates the average values and SEM. On average, ICc contains a higher density of WFA-labeled PNs than ICd or IClc. Error bars = SEM.
FIGURE 5
FIGURE 5
WFA-labeled PNs surround both GAD+ and GAD-negative IC cells. (A) Photomicrographs from IClc (left column) and ICd (right column) showing WFA-labeled PNs (top row) and cells stained with antibodies to GAD (middle row). Bottom row shows the merged images, revealing PNs around GAD+ (arrows) and GAD-negative (arrowheads) IC cells. Scale bar = 50 μm. Case GP691. (B) Graph showing the percentages of WFA-labeled PNs that surround GAD+ (purple bars) vs. PNs that surround GAD-negative (green bars) cells in each IC subdivision. The symbols in the legend correspond to those in (A). Error bars = SEM; data are averaged across 74 sections in nine animals.
FIGURE 6
FIGURE 6
Photomicrographs showing anti-VAChT staining in the laterodorsal tegmental nucleus (LDT, a midbrain cholinergic nucleus) and the IC under different pre-adsorption conditions. (A). Somatic staining in the LDT (top row) and PN-like staining in the IC (bottom row) following application of anti-VAChT antibody to guinea pig tissue. (B). Following pre-adsorption of the anti-VAChT antibody with VAChT protein, somatic staining in the LDT is abolished (top) but PN-like staining in the ICc remains (bottom). (C). Following pre-adsorption of the anti-VAChT antibody with N-acetylgalactosamine (GalNac, the target of WFA binding), somatic staining is present in the LDT (top), but net-like staining in the ICc is abolished (bottom). Scale bar = 50 μm. Case GP691.
FIGURE 7
FIGURE 7
Photomicrographs showing anti-VAChT co-staining with WFA-labeled PNs in the IC. Top row: PNs in the ICc are stained with WFA. Right column is an enlargement of boxed area in top left photograph. Middle row: the same areas as top row, viewed to reveal anti-VAChT staining. Bottom row: merged images; yellow color indicates regions of direct overlap of green and red signals. Solid arrowheads: PNs labeled with WFA only; Open arrowheads: PNs labeled with VAChT only. Arrows: PNs labeled with both WFA and VAChT. Scale bars = 50 μm. Case GP691.
FIGURE 8
FIGURE 8
Merged photomicrographs showing anti-VAChT labeled PNs surrounding either GAD+ cells (arrows) or a GAD-negative cell (arrowhead). A GAD+ cell without an anti-VAChT labeled PN is also present (asterisk). Images from ICc. Scale bar = 10 μm. Case GP613.
FIGURE 9
FIGURE 9
A subset of IC GAD+ cells are surrounded by WFA-labeled PNs. (A). Photomicrographs from ICc (left column) and IClc (right column) showing GAD+ cells that are surrounded by PNs (arrows) and GAD+ cells that are not surrounded by PNs (arrowheads). Top row: two different areas stained for GAD. Middle row: same areas as top row, showing WFA staining for PNs. Bottom row: merged image showing GAD+ cells with or without PNs. Scale bar = 50 μm. Case GP691. (B). Graph showing the percentage of GAD+ cells in each IC subdivision that are surrounded by PNs (green bars) or not surrounded by PNs (purple bars). Error bars = SEM; data were averaged across 74 sections in nine animals.
FIGURE 10
FIGURE 10
Photomicrographs showing association of PNs and VGLUT2-immunopositive perisomatic bouton rings with GAD+ cells. Examples are shown from the ICd (left column) and ICc (right column). Each column shows a region stained for GAD (top row), VGLUT2 (second row), and WFA (third row). Bottom row: merged images showing all three markers. GAD cells, top row, are indicated by four different symbols that represent the four possible relationships with PNs and VGLUT2 rings. Arrows (left column) show GAD+ cells that have VGLUT2+ rings and WFA-stained PNs. Open arrowhead (left column) shows a GAD+ cell that lacks a VGLUT+ ring but is surrounded by a PN. Solid arrowhead (right column) shows a GAD+ cell that is surrounded by a VGLUT2 ring but lacks a WFA-stained PN. Asterisk (right column) is adjacent to a small GAD+ cell that has neither a PN nor a VGLUT2 ring. Note that one PN (bottom left corner of the right column) surrounds a GABA-negative cell. Scale bar = 20 μm. Case GP710.

Similar articles

Cited by

References

    1. Ajmo J. M., Eakin A. K., Hamel M. G., Gottschall P. E. (2008). Discordant localization of WFA reactivity and brevican/ADAMTS-derived fragment in rodent brain. BMC Neurosci. 9:14 10.1186/1471-2202-9-14 - DOI - PMC - PubMed
    1. Atoji Y., Yamamoto Y., Suzuki Y., Matsui F., Oohira A. (1997). Immunohistochemical localization of neurocan in the lower auditory nuclei of the dog. Hear. Res. 110 200–208 10.1016/S0378-5955(97)00079-8 - DOI - PubMed
    1. Balmer T. S., Carels V. M., Frisch J. L., Nick T. A. (2009). Modulation of perineuronal nets and parvalbumin with developmental song learning. J. Neurosci. 29 12878–12885 10.1523/JNEUROSCI.2974-09.2009 - DOI - PMC - PubMed
    1. Belichenko P. V., Miklossy J., Belser B., Budka H., Celio M. R. (1999). Early destruction of the extracellular matrix around parvalbumin-immunoreactive interneurons in Creutzfeldt-Jakob disease. Neurobiol. Dis. 6 269–279 10.1006/nbdi.1999.0245 - DOI - PubMed
    1. Bertolotto A., Manzardo E., Guglielmone R. (1996). Immunohistochemical mapping of perineuronal nets containing chondroitin unsulfated proteoglycan in the rat central nervous system. Cell Tissue Res. 283 283–295 10.1007/s004410050538 - DOI - PubMed

LinkOut - more resources