. 2013 Dec 3:7:817.
doi: 10.3389/fnhum.2013.00817. eCollection 2013.

Functional diffusion tensor imaging at 3 Tesla

Affiliations

Functional diffusion tensor imaging at 3 Tesla

René C W Mandl et al. Front Hum Neurosci. .

Abstract

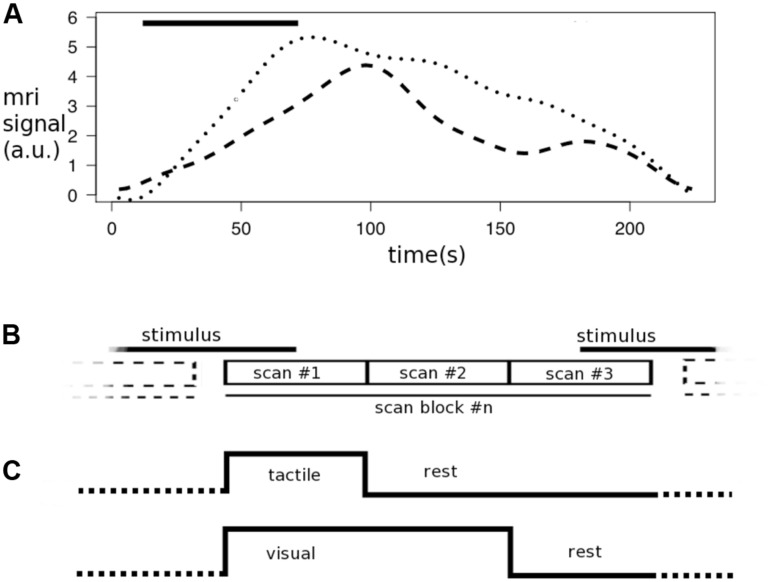
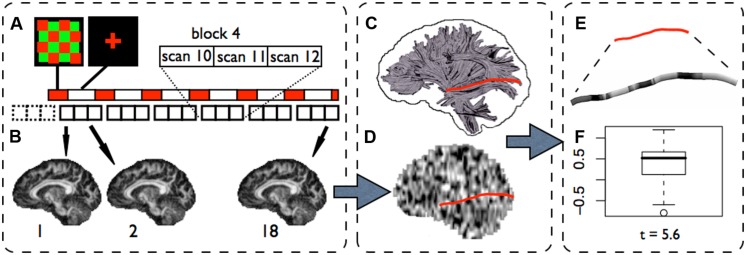
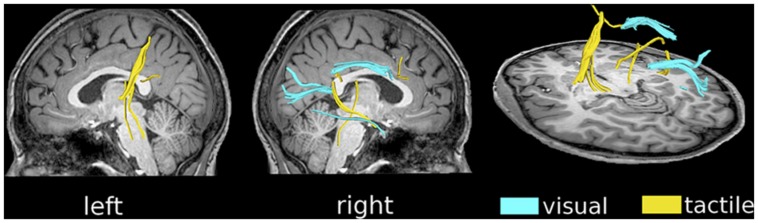
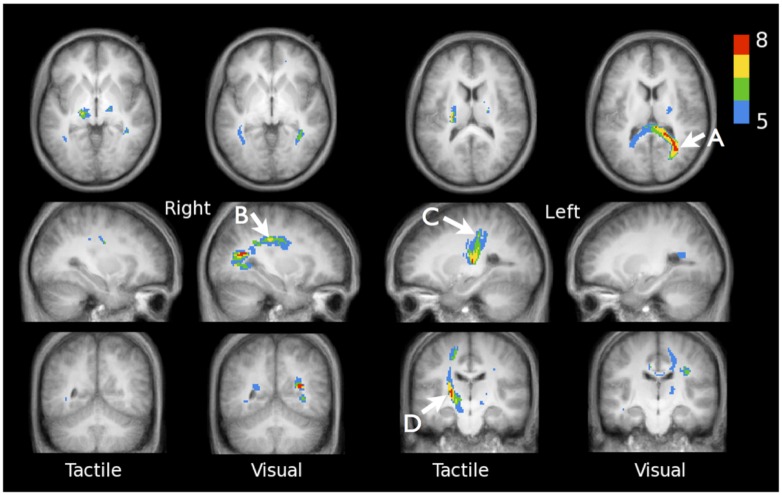
In a previous study we reported on a non-invasive functional diffusion tensor imaging (fDTI) method to measure neuronal signals directly from subtle changes in fractional anisotropy along white matter tracts. We hypothesized that these fractional anisotropy changes relate to morphological changes of glial cells induced by axonal activity. In the present study we set out to replicate the results of the previous study with an improved fDTI scan acquisition scheme. A group of twelve healthy human participants were scanned on a 3 Tesla MRI scanner. Activation was revealed in the contralateral thalamo-cortical tract and optic radiations during tactile and visual stimulation, respectively. Mean percent signal change in FA was 3.47% for the tactile task and 3.79% for the visual task, while for the MD the mean percent signal change was only -0.10 and -0.09%. The results support the notion of different response functions for tactile and visual stimuli. With this study we successfully replicated our previous findings using the same types of stimuli but on a different group of healthy participants and at different field-strength. The successful replication of our first fDTI results suggests that the non-invasive fDTI method is robust enough to study the functional neural networks in the human brain within a practically feasible time period.

Keywords: DTI; MRI imaging; activation; task performance and analysis; white matter.


Figures

FIGURE 1
FIGURE 1
Response functions and task encoding. The graphs represent the time course of the measured diffusion weighted MRI signal for a single tactile stimulus (dots) or visual stimulus (dashes; adapted from Mandl et al., 2008) and the scan in combination with a scan block as used in the fDTI experiment. (A) Both the tactile stimulus and visual stimulus (bar) started after 12 s with a duration of 60 s. (B) The results of the response function experiment show that the maximum of the response function (dotted line) for the tactile stimulus (bar) falls within the first scan of a scan block while the maximum of the response function (dashed line) of the visual stimulus is found between the first and second scan. (C) Therefore in the fDTI experiment the tactile task the first scan is contrasted against the second and third scan, while for the visual task the first and second scan are contrasted against the third scan. The signal during the stimulus is constantly increasing (reflecting a reduction in diffusivity in the transverse direction of the tract).
FIGURE 2
FIGURE 2
The fDTI method (visual experiment). (A) In the fDTI experiment 1+6 blocks of 3 DTI scans are acquired. The first block (dashed lines) is a dummy block added to correct for possible scanner onset effects and is disregarded in the further analysis. The necessity for the lag between task and scans is explained in Figure 2. For each of the 18 DTI scans an FA map is computed (B). A statistical parameter map (SPM) is computed (D) on the FA maps using a general linear model. Fiber tracts are reconstructed for the complete brain (C) and, for each tract, the t-values found in the SPM along that tract were grouped into a single set of t-values (E). For each tract a statistical test (student’s t-test) is done (F) on the set of t-values to test if the average t-value found along the tract is significantly (t > 5) greater then zero.
FIGURE 3
FIGURE 3
fDTI results for a single subject. Tracts that were found active during the visual task (blue) and the tactile task (yellow) using the fDTI method. During the tactile task, activation was found predominantly contra-laterally for the thalamo-cortical tracts running from the thalamus to the primary sensory cortical area. Activation during the visual task was found, amongst others, for tracts that are part of the optic radiation and the genu of the corpus callosum.
FIGURE 4
FIGURE 4
Accumulated fDTI results of all 12 individuals for the tactile and visual tasks. For both tasks the cumulative fDTI results were computed and overlaid on the subjects’ average anatomy. The value of a (colored) voxel represents the minimum number of subjects for which active fibers are found at that position. Visual activation is found for tracts that are part of the forceps major (A) MNI-coordinate (31, -58, 16), superior longitudinal fasciculus (B) MNI-coordinate (31, -24, 34), and at positions that correspond with the optic radiations. The results show that the majority of the tactile activation is found in the contralateral tracts connecting the thalamus and sensory cortex. Maximum cumulative values are found at MNI-coordinates (-27, -30, 34; C) and (-19, -22, -3; D).

Similar articles

Cited by

References

    1. Anderson A. W., Zhong J., Petroff O. A., Szafer A., Ransom B. R., Prichard J. W., et al. (1996). Effects of osmotically driven cell volume changes on diffusion-weighted imaging of the rat optic nerve. Magn. Reson. Med. 35 162–167 10.1002/mrm.1910350206 - DOI - PubMed
    1. Andersson J. L., Skare S. (2002). A model-based method for retrospective correction of geometric distortions in diffusion-weighted EPI. Neuroimage 16 177–199 10.1006/nimg.2001.1039 - DOI - PubMed
    1. Andersson J. L., Skare S., Ashburner J. (2003). How to correct susceptibility distortions in spin-echo echo-planar images: application to diffusion tensor imaging. Neuroimage 20 870–888 10.1016/S1053-8119(03)00336-7 - DOI - PubMed
    1. Aso T., Urayama S., Poupon C., Sawamoto N., Fukuyama H., Le Bihan D. (2009). An intrinsic diffusion response function for analyzing diffusion functional MRI time series. Neuroimage 47 1487–1495 10.1016/j.neuroimage.2009.05.027 - DOI - PubMed
    1. Autio J. A., Kershaw J., Shibata S., Obata T., Kanno I., Aoki I. (2011). High b-value diffusion-weighted fMRI in a rat forepaw electrostimulation model at 7 T. Neuroimage 57 140–148 10.1016/j.neuroimage.2011.04.006 - DOI - PubMed

LinkOut - more resources