A staging scheme for the development of the scuttle fly Megaselia abdita
- PMID: 24409295
- PMCID: PMC3883658
- DOI: 10.1371/journal.pone.0084421
A staging scheme for the development of the scuttle fly Megaselia abdita
Abstract
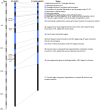
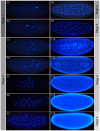
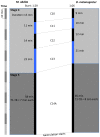
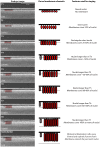
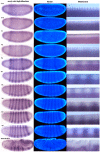
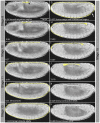
Model organisms, such as Drosophila melanogaster, provide powerful experimental tools for the study of development. However, approaches using model systems need to be complemented by comparative studies for us to gain a deeper understanding of the functional properties and evolution of developmental processes. New model organisms need to be established to enable such comparative work. The establishment of new model system requires a detailed description of its life cycle and development. The resulting staging scheme is essential for providing morphological context for molecular studies, and allows us to homologise developmental processes between species. In this paper, we provide a staging scheme and morphological characterisation of the life cycle for an emerging non-drosophilid dipteran model system: the scuttle fly Megaselia abdita. We pay particular attention to early embryogenesis (cleavage and blastoderm stages up to gastrulation), the formation and retraction of extraembryonic tissues, and the determination and formation of germ (pole) cells. Despite the large evolutionary distance between the two species (approximately 150 million years), we find that M. abdita development is remarkably similar to D. melanogaster in terms of developmental landmarks and their relative timing.
Conflict of interest statement
Figures




Similar articles
-
High-resolution gene expression data from blastoderm embryos of the scuttle fly Megaselia abdita.Sci Data. 2015 Mar 3;2:150005. doi: 10.1038/sdata.2015.5. eCollection 2015. Sci Data. 2015. PMID: 25977812 Free PMC article.
-
How two extraembryonic epithelia became one: serosa and amnion features and functions of Drosophila's amnioserosa.Philos Trans R Soc Lond B Biol Sci. 2022 Dec 5;377(1865):20210265. doi: 10.1098/rstb.2021.0265. Epub 2022 Oct 17. Philos Trans R Soc Lond B Biol Sci. 2022. PMID: 36252222 Free PMC article. Review.
-
A staging scheme for the development of the moth midge Clogmia albipunctata.PLoS One. 2014 Jan 7;9(1):e84422. doi: 10.1371/journal.pone.0084422. eCollection 2014. PLoS One. 2014. PMID: 24409296 Free PMC article.
-
Maternal co-ordinate gene regulation and axis polarity in the scuttle fly Megaselia abdita.PLoS Genet. 2015 Mar 10;11(3):e1005042. doi: 10.1371/journal.pgen.1005042. eCollection 2015 Mar. PLoS Genet. 2015. PMID: 25757102 Free PMC article.
-
Natural history of the scuttle fly, Megaselia scalaris.Annu Rev Entomol. 2008;53:39-60. doi: 10.1146/annurev.ento.53.103106.093415. Annu Rev Entomol. 2008. PMID: 17622197 Review.
Cited by
-
High-resolution gene expression data from blastoderm embryos of the scuttle fly Megaselia abdita.Sci Data. 2015 Mar 3;2:150005. doi: 10.1038/sdata.2015.5. eCollection 2015. Sci Data. 2015. PMID: 25977812 Free PMC article.
-
Decoupling from yolk sac is required for extraembryonic tissue spreading in the scuttle fly Megaselia abdita.Elife. 2018 Oct 30;7:e34616. doi: 10.7554/eLife.34616. Elife. 2018. PMID: 30375972 Free PMC article.
-
Functional evolution of a morphogenetic gradient.Elife. 2016 Dec 22;5:e20894. doi: 10.7554/eLife.20894. Elife. 2016. PMID: 28005004 Free PMC article.
-
How two extraembryonic epithelia became one: serosa and amnion features and functions of Drosophila's amnioserosa.Philos Trans R Soc Lond B Biol Sci. 2022 Dec 5;377(1865):20210265. doi: 10.1098/rstb.2021.0265. Epub 2022 Oct 17. Philos Trans R Soc Lond B Biol Sci. 2022. PMID: 36252222 Free PMC article. Review.
-
A staging scheme for the development of the moth midge Clogmia albipunctata.PLoS One. 2014 Jan 7;9(1):e84422. doi: 10.1371/journal.pone.0084422. eCollection 2014. PLoS One. 2014. PMID: 24409296 Free PMC article.
References
-
- Abzhanov A, Extavour CG, Groover A, Hodges SA, Hoekstra HE, et al. (2008) Are we there yet? Tracking the development of new model systems. Trends Genet 24: 353–60. - PubMed
-
- Jenner RA, Wills MA (2007) The choice of model organisms in evo-devo. Nat Rev Genet 8: 311–9. - PubMed
-
- Sommer RJ (2009) The future of evo-devo: model systems and evolutionary theory. Nat Rev Genet 10: 416–22. - PubMed
-
- Stanley MSM, Grundmann AW (1970) The embryonic development of Tribolium confusum. Ann Entomol Soc Am 63: 1248–56.
-
- Handel K, Grünfelder CG, Roth S, Sander K (2000) Tribolium embryogenesis: a SEM study of cell shapes and movements from blastoderm to serosal closure. Dev Genes Evol 210: 167–79. - PubMed
Publication types
MeSH terms
LinkOut - more resources
Full Text Sources
Other Literature Sources

