Visualizing cell state transition using Raman spectroscopy
- PMID: 24409302
- PMCID: PMC3883674
- DOI: 10.1371/journal.pone.0084478
Visualizing cell state transition using Raman spectroscopy
Abstract
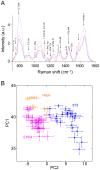
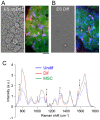
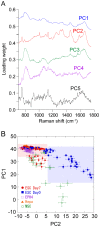
System level understanding of the cell requires detailed description of the cell state, which is often characterized by the expression levels of proteins. However, understanding the cell state requires comprehensive information of the cell, which is usually obtained from a large number of cells and their disruption. In this study, we used Raman spectroscopy, which can report changes in the cell state without introducing any label, as a non-invasive method with single cell capability. Significant differences in Raman spectra were observed at the levels of both the cytosol and nucleus in different cell-lines from mouse, indicating that Raman spectra reflect differences in the cell state. Difference in cell state was observed before and after the induction of differentiation in neuroblastoma and adipocytes, showing that Raman spectra can detect subtle changes in the cell state. Cell state transitions during embryonic stem cell (ESC) differentiation were visualized when Raman spectroscopy was coupled with principal component analysis (PCA), which showed gradual transition in the cell states during differentiation. Detailed analysis showed that the diversity between cells are large in undifferentiated ESC and in mesenchymal stem cells compared with terminally differentiated cells, implying that the cell state in stem cells stochastically fluctuates during the self-renewal process. The present study strongly indicates that Raman spectral morphology, in combination with PCA, can be used to establish cells' fingerprints, which can be useful for distinguishing and identifying different cellular states.
Conflict of interest statement
Figures


Similar articles
-
Visualizing the appearance and disappearance of the attractor of differentiation using Raman spectral imaging.Sci Rep. 2015 Jun 16;5:11358. doi: 10.1038/srep11358. Sci Rep. 2015. PMID: 26079396 Free PMC article.
-
Raman imaging diagnosis of the early stage differentiation of mouse embryonic stem cell (mESC).Spectrochim Acta A Mol Biomol Spectrosc. 2020 Jan 5;224:117438. doi: 10.1016/j.saa.2019.117438. Epub 2019 Jul 29. Spectrochim Acta A Mol Biomol Spectrosc. 2020. PMID: 31377684
-
Comparative study using Raman microspectroscopy reveals spectral signatures of human induced pluripotent cells more closely resemble those from human embryonic stem cells than those from differentiated cells.Analyst. 2012 Oct 7;137(19):4509-15. doi: 10.1039/c2an35507h. Analyst. 2012. PMID: 22888493
-
Following Embryonic Stem Cells, Their Differentiated Progeny, and Cell-State Changes During iPS Reprogramming by Raman Spectroscopy.Anal Chem. 2020 Nov 17;92(22):14915-14923. doi: 10.1021/acs.analchem.0c01800. Epub 2020 Oct 28. Anal Chem. 2020. PMID: 33112148
-
Optical spectroscopy for noninvasive monitoring of stem cell differentiation.J Biomed Biotechnol. 2010;2010:101864. doi: 10.1155/2010/101864. Epub 2010 Feb 16. J Biomed Biotechnol. 2010. PMID: 20182537 Free PMC article. Review.
Cited by
-
Raman Spectroscopy for Chemical Biology Research.J Am Chem Soc. 2022 Nov 2;144(43):19651-19667. doi: 10.1021/jacs.2c05359. Epub 2022 Oct 10. J Am Chem Soc. 2022. PMID: 36216344 Free PMC article. Review.
-
Visualizing the appearance and disappearance of the attractor of differentiation using Raman spectral imaging.Sci Rep. 2015 Jun 16;5:11358. doi: 10.1038/srep11358. Sci Rep. 2015. PMID: 26079396 Free PMC article.
-
Bright Dots and Smart Optical Microscopy to Probe Intracellular Events in Single Cells.Front Bioeng Biotechnol. 2019 Jan 4;6:204. doi: 10.3389/fbioe.2018.00204. eCollection 2018. Front Bioeng Biotechnol. 2019. PMID: 30662896 Free PMC article. Review.
-
Label-free Molecular Imaging and Analysis by Raman Spectroscopy.Acta Histochem Cytochem. 2018 Jun 26;51(3):101-110. doi: 10.1267/ahc.18019. Epub 2018 Jun 20. Acta Histochem Cytochem. 2018. PMID: 30083018 Free PMC article.
-
New Possibilities for Evaluating the Development of Age-Related Pathologies Using the Dynamical Network Biomarkers Theory.Cells. 2023 Sep 17;12(18):2297. doi: 10.3390/cells12182297. Cells. 2023. PMID: 37759519 Free PMC article. Review.
References
-
- Kitano H (2002) Systems biology: a brief overview. Science 295: 1662–1664. - PubMed
-
- Waddington CH (1957) The Strategy of the Genes. London: Geo Allen & Unwin.
Publication types
MeSH terms
LinkOut - more resources
Full Text Sources
Other Literature Sources
Research Materials

