

Assessment of whole genome amplification for sequence capture and massively parallel sequencing
- PMID: 24409309
- PMCID: PMC3883664
- DOI: 10.1371/journal.pone.0084785
Assessment of whole genome amplification for sequence capture and massively parallel sequencing
Abstract
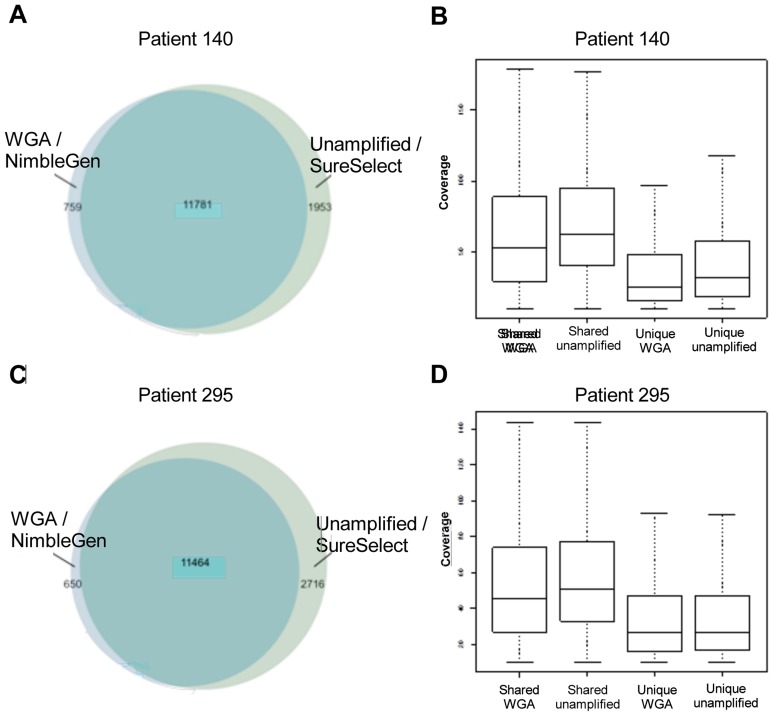
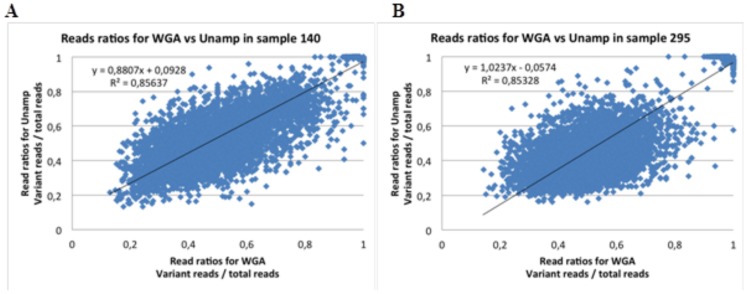
Exome sequence capture and massively parallel sequencing can be combined to achieve inexpensive and rapid global analyses of the functional sections of the genome. The difficulties of working with relatively small quantities of genetic material, as may be necessary when sharing tumor biopsies between collaborators for instance, can be overcome using whole genome amplification. However, the potential drawbacks of using a whole genome amplification technology based on random primers in combination with sequence capture followed by massively parallel sequencing have not yet been examined in detail, especially in the context of mutation discovery in tumor material. In this work, we compare mutations detected in sequence data for unamplified DNA, whole genome amplified DNA, and RNA originating from the same tumor tissue samples from 16 patients diagnosed with non-small cell lung cancer. The results obtained provide a comprehensive overview of the merits of these techniques for mutation analysis. We evaluated the identified genetic variants, and found that most (74%) of them were observed in both the amplified and the unamplified sequence data. Eighty-nine percent of the variations found by WGA were shared with unamplified DNA. We demonstrate a strategy for avoiding allelic bias by including RNA-sequencing information.
Conflict of interest statement
Figures
Similar articles
-
Assessment of whole genome amplification-induced bias through high-throughput, massively parallel whole genome sequencing.BMC Genomics. 2006 Aug 23;7:216. doi: 10.1186/1471-2164-7-216. BMC Genomics. 2006. PMID: 16928277 Free PMC article.
-
Genomic Analysis of Circulating Tumor Cells at the Single-Cell Level.J Mol Diagn. 2020 Jun;22(6):770-781. doi: 10.1016/j.jmoldx.2020.02.013. Epub 2020 Apr 2. J Mol Diagn. 2020. PMID: 32247862 Free PMC article.
-
Mutation profile of non-small cell lung cancer revealed by next generation sequencing.Respir Res. 2021 Jan 6;22(1):3. doi: 10.1186/s12931-020-01608-5. Respir Res. 2021. PMID: 33407425 Free PMC article.
-
Whole Genome Amplification in Preimplantation Genetic Testing in the Era of Massively Parallel Sequencing.Int J Mol Sci. 2022 Apr 27;23(9):4819. doi: 10.3390/ijms23094819. Int J Mol Sci. 2022. PMID: 35563216 Free PMC article. Review.
-
Emerging patterns of somatic mutations in cancer.Nat Rev Genet. 2013 Oct;14(10):703-18. doi: 10.1038/nrg3539. Epub 2013 Sep 11. Nat Rev Genet. 2013. PMID: 24022702 Free PMC article. Review.
Cited by
-
A framework for the estimation of the proportion of true discoveries in single nucleotide variant detection studies for human data.PLoS One. 2018 Apr 25;13(4):e0196058. doi: 10.1371/journal.pone.0196058. eCollection 2018. PLoS One. 2018. PMID: 29694377 Free PMC article.
-
Comparison of whole genome amplification techniques for human single cell exome sequencing.PLoS One. 2017 Feb 16;12(2):e0171566. doi: 10.1371/journal.pone.0171566. eCollection 2017. PLoS One. 2017. PMID: 28207771 Free PMC article.
-
Precision Oncology Decision Support: Current Approaches and Strategies for the Future.Clin Cancer Res. 2018 Jun 15;24(12):2719-2731. doi: 10.1158/1078-0432.CCR-17-2494. Epub 2018 Feb 2. Clin Cancer Res. 2018. PMID: 29420224 Free PMC article. Review.
-
Capturing the 'ome': the expanding molecular toolbox for RNA and DNA library construction.Nucleic Acids Res. 2018 Apr 6;46(6):2701-2721. doi: 10.1093/nar/gky167. Nucleic Acids Res. 2018. PMID: 29514322 Free PMC article. Review.
-
Exome sequencing of primary breast cancers with paired metastatic lesions reveals metastasis-enriched mutations in the A-kinase anchoring protein family (AKAPs).BMC Cancer. 2018 Feb 12;18(1):174. doi: 10.1186/s12885-018-4021-6. BMC Cancer. 2018. PMID: 29433456 Free PMC article.
References
-
- Stahl PL, Lundeberg J (2012) Toward the single-hour high-quality genome. Annual review of biochemistry 81: 359–378. - PubMed
-
- Yilmaz S, Allgaier M, Hugenholtz P (2010) Multiple displacement amplification compromises quantitative analysis of metagenomes. Nat Methods 7: 943–944. - PubMed
-
- Duhaime MB, Sullivan MB (2012) Ocean viruses: rigorously evaluating the metagenomic sample-to-sequence pipeline. Virology 434: 181–186. - PubMed
Publication types
MeSH terms
LinkOut - more resources
Full Text Sources
Other Literature Sources
