

The prevalence of chromosomal deletions relating to developmental delay and/or intellectual disability in human euploid blastocysts
- PMID: 24409323
- PMCID: PMC3883698
- DOI: 10.1371/journal.pone.0085207
The prevalence of chromosomal deletions relating to developmental delay and/or intellectual disability in human euploid blastocysts
Abstract
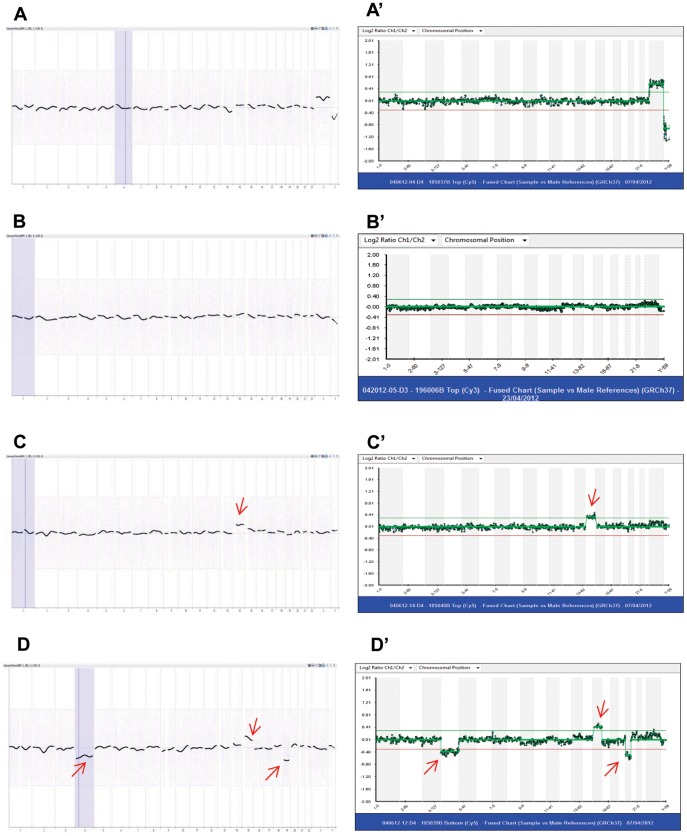
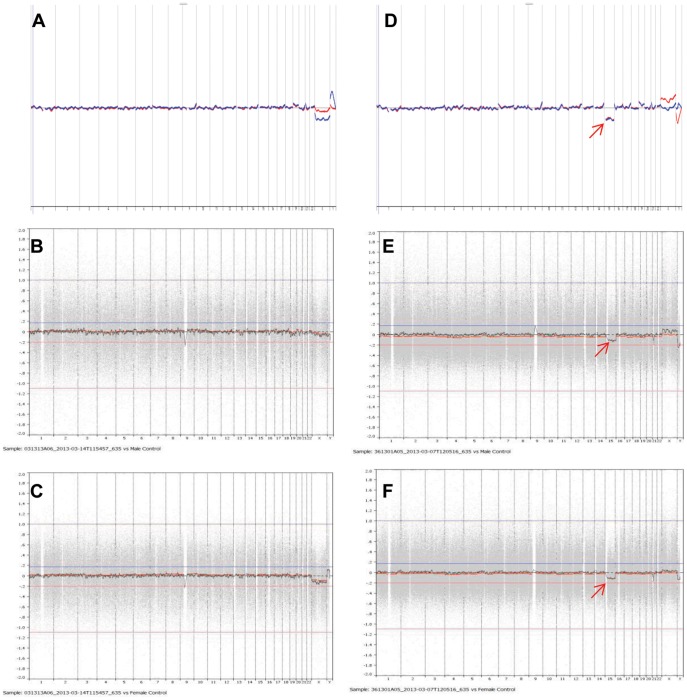
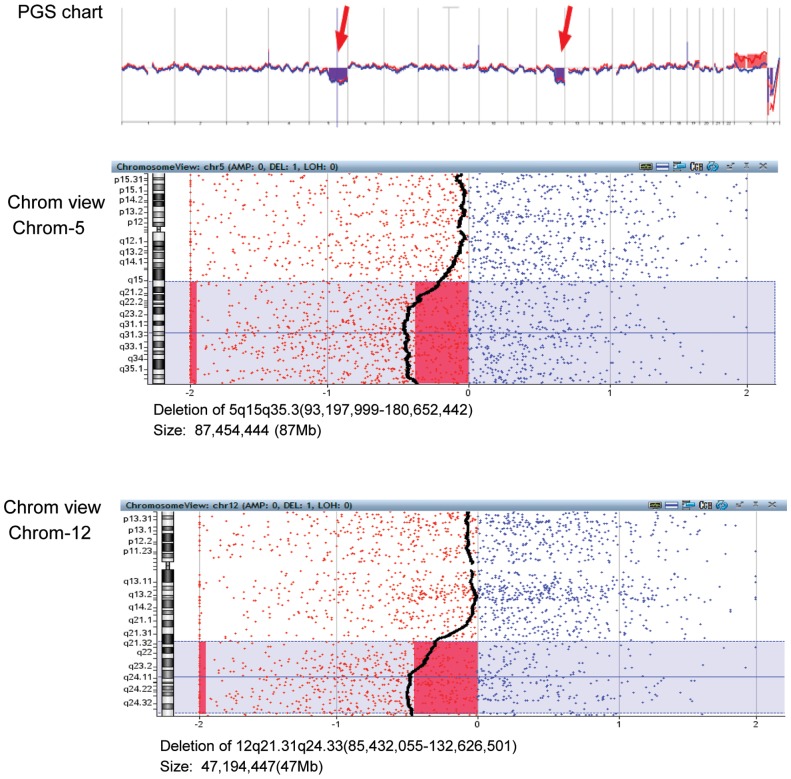
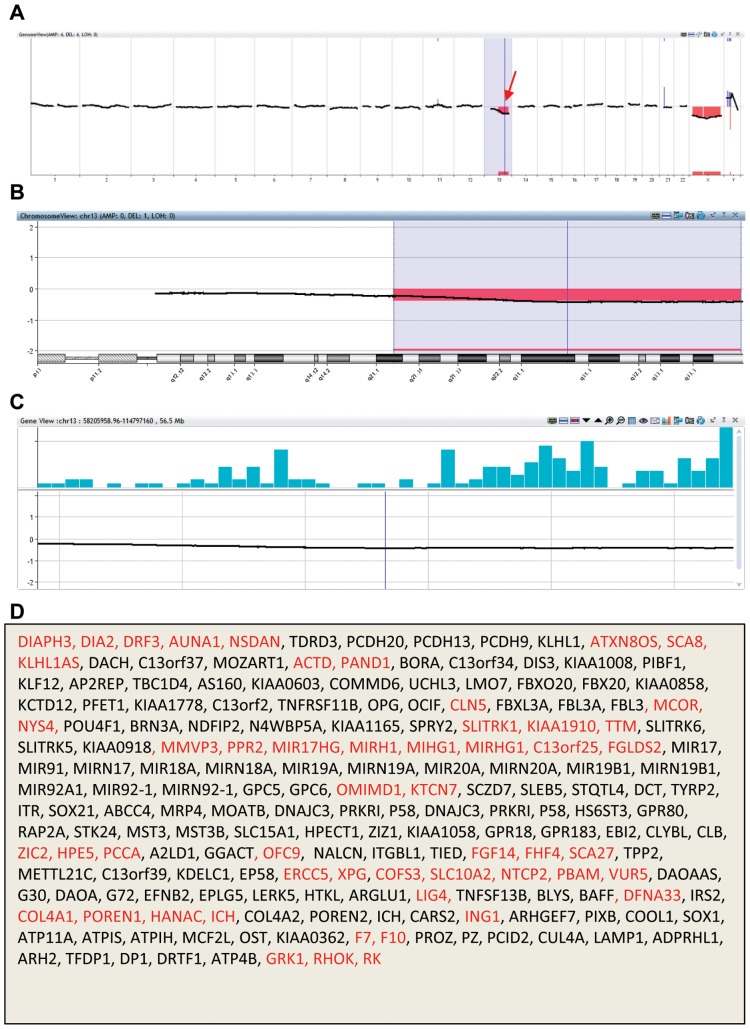
Chromosomal anomalies in human embryos produced by in vitro fertilization are very common, which include numerical (aneuploidy) and structural (deletion, duplication or others) anomalies. Our previous study indicated that chromosomal deletion(s) is the most common structural anomaly accounting for approximately 8% of euploid blastocysts. It is still unknown if these deletions in human euploid blastocysts have clinical significance. In this study, we analyzed 15 previously diagnosed euploid blastocysts that had chromosomal deletion(s) using Agilent oligonucleotide DNA microarray platform and localized the gene location in each deletion. Then, we used OMIM gene map and phenotype database to investigate if these deletions are related with some important genes that cause genetic diseases, especially developmental delay or intellectual disability. As results, we found that the detectable chromosomal deletion size with Agilent microarray is above 2.38 Mb, while the deletions observed in human blastocysts are between 11.6 to 103 Mb. With OMIM gene map and phenotype database information, we found that deletions can result in loss of 81-464 genes. Out of these genes, 34-149 genes are related with known genetic problems. Furthermore, we found that 5 out of 15 samples lost genes in the deleted region, which were related to developmental delay and/or intellectual disability. In conclusion, our data indicates that all human euploid blastocysts with chromosomal deletion(s) are abnormal and transfer of these embryos may cause birth defects and/or developmental and intellectual disabilities. Therefore, the embryos with chromosomal deletion revealed by DNA microarray should not be transferred to the patients, or further gene map and/or phenotype seeking is necessary before making a final decision.
Conflict of interest statement
Figures
Similar articles
-
Identification of chromosomal errors in human preimplantation embryos with oligonucleotide DNA microarray.PLoS One. 2013 Apr 16;8(4):e61838. doi: 10.1371/journal.pone.0061838. Print 2013. PLoS One. 2013. PMID: 23613950 Free PMC article.
-
The cytogenetic constitution of human blastocysts: insights from comprehensive chromosome screening strategies.Hum Reprod Update. 2019 Jan 1;25(1):15-33. doi: 10.1093/humupd/dmy036. Hum Reprod Update. 2019. PMID: 30395265 Review.
-
Chromosomal Microarray With Clinical Diagnostic Utility in Children With Developmental Delay or Intellectual Disability.Ann Lab Med. 2018 Sep;38(5):473-480. doi: 10.3343/alm.2018.38.5.473. Ann Lab Med. 2018. PMID: 29797819 Free PMC article.
-
Assessment of clinical application of preimplantation genetic screening on cryopreserved human blastocysts.Reprod Biol Endocrinol. 2016 Apr 8;14:16. doi: 10.1186/s12958-016-0155-z. Reprod Biol Endocrinol. 2016. PMID: 27059821 Free PMC article.
-
Chromosomal mosaicism in human blastocysts: the ultimate diagnostic dilemma.Hum Reprod Update. 2020 Apr 15;26(3):313-334. doi: 10.1093/humupd/dmz050. Hum Reprod Update. 2020. PMID: 32141501 Review.
Cited by
-
Earlier day of blastocyst development is predictive of embryonic euploidy across all ages: essential data for physician decision-making and counseling patients.J Assist Reprod Genet. 2018 Jan;35(1):119-125. doi: 10.1007/s10815-017-1038-8. Epub 2017 Sep 11. J Assist Reprod Genet. 2018. PMID: 28894983 Free PMC article.
-
Diagnosis of parental balanced reciprocal translocations by trophectoderm biopsy and comprehensive chromosomal screening.J Assist Reprod Genet. 2018 Jan;35(1):165-169. doi: 10.1007/s10815-017-1042-z. Epub 2017 Sep 12. J Assist Reprod Genet. 2018. PMID: 28900794 Free PMC article.
-
Internet-Based Abnormal Chromosomal Diagnosis During Pregnancy Using a Noninvasive Innovative Approach to Detecting Chromosomal Abnormalities in the Fetus: Scoping Review.JMIR Bioinform Biotechnol. 2024 Oct 16;5:e58439. doi: 10.2196/58439. JMIR Bioinform Biotechnol. 2024. PMID: 39412876 Free PMC article.
-
Arrested human embryos are more likely to have abnormal chromosomes than developing embryos from women of advanced maternal age.J Ovarian Res. 2014 Jun 13;7:65. doi: 10.1186/1757-2215-7-65. eCollection 2014. J Ovarian Res. 2014. PMID: 24955133 Free PMC article.
-
Estradiol to progesterone ratio is not a predictor of oocyte maturity at time of ovulation trigger.J Assist Reprod Genet. 2022 Jul;39(7):1667-1672. doi: 10.1007/s10815-022-02491-3. Epub 2022 Jun 7. J Assist Reprod Genet. 2022. PMID: 35672539 Free PMC article.
References
-
- Hassold T, Hunt P (2001) To err(meiotically)is human: the genesis of human aneuploidy. Nat Rev Genet 2: 280–291. - PubMed
-
- Jones K (2008) Meiosis in oocytes: predisposition to aneuploidy and its increased incidence with age. Hum Reprod Update 14: 143–158. - PubMed
-
- Miao YL, Kikuchi K, Sun QY, Schatten H (2009) Oocyte aging: implications for developmental potential, and practical significance for assisted reproduction technologies. Hum Reprod Update 15: 573–585. - PubMed
-
- Wang ZB, Schatten H, Sun QY (2011) Why is chromosome segregation error in oocytes increased with maternal aging? Physiology 26: 314–325. - PubMed
Publication types
MeSH terms
LinkOut - more resources
Full Text Sources
Other Literature Sources
Medical
Research Materials
Miscellaneous
