

Design of optimized hypoxia-activated prodrugs using pharmacokinetic/pharmacodynamic modeling
- PMID: 24409417
- PMCID: PMC3873531
- DOI: 10.3389/fonc.2013.00314
Design of optimized hypoxia-activated prodrugs using pharmacokinetic/pharmacodynamic modeling
Abstract
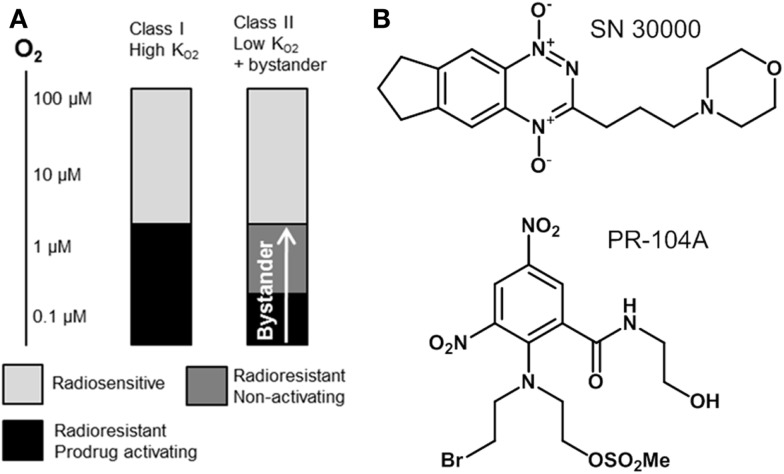
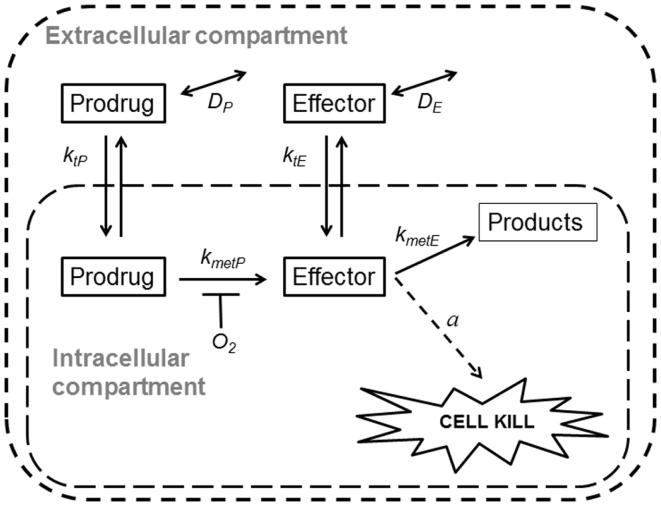
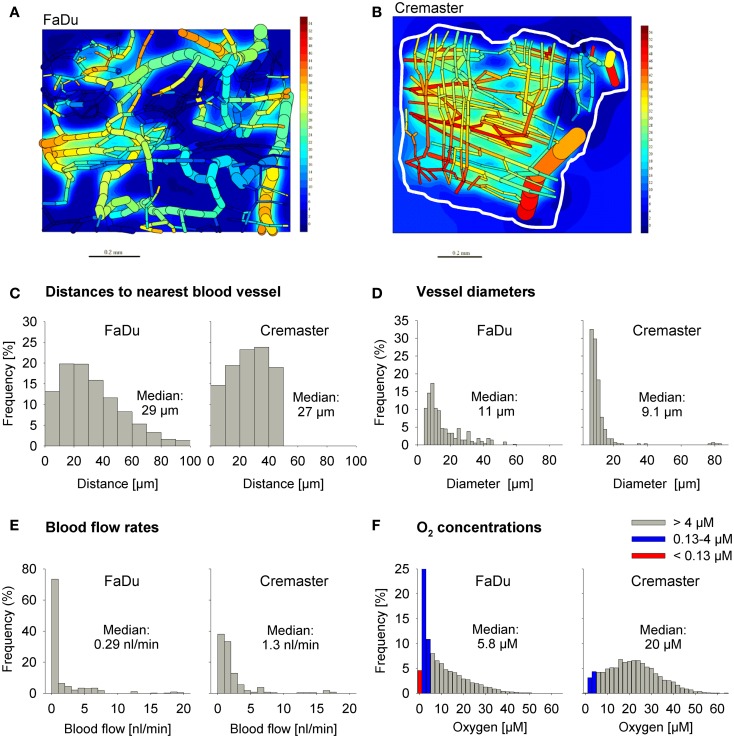
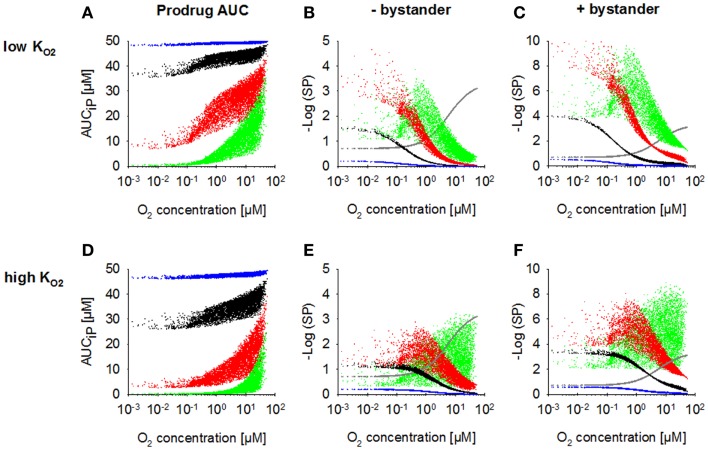
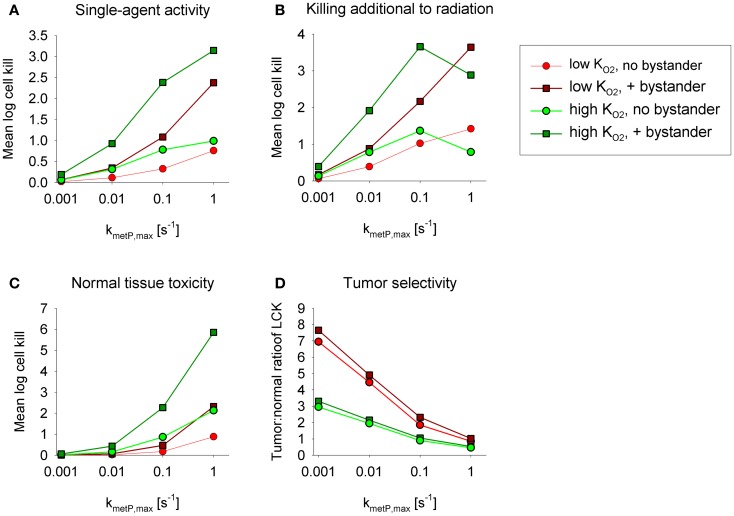
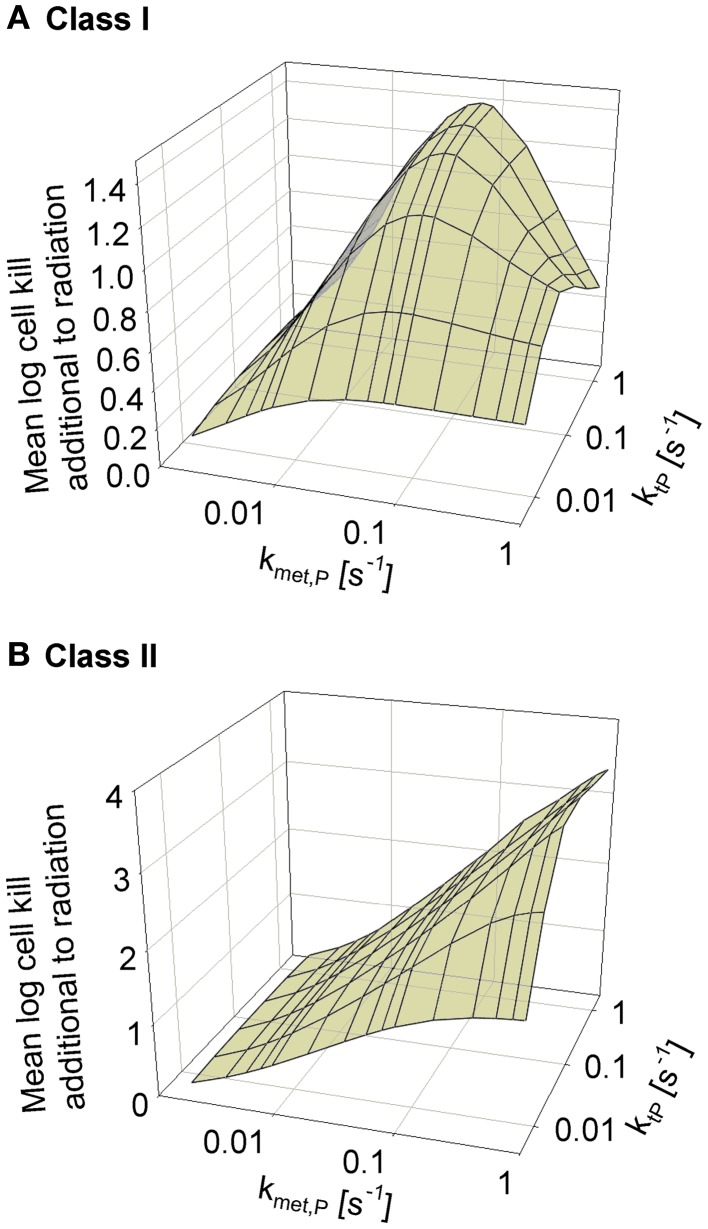
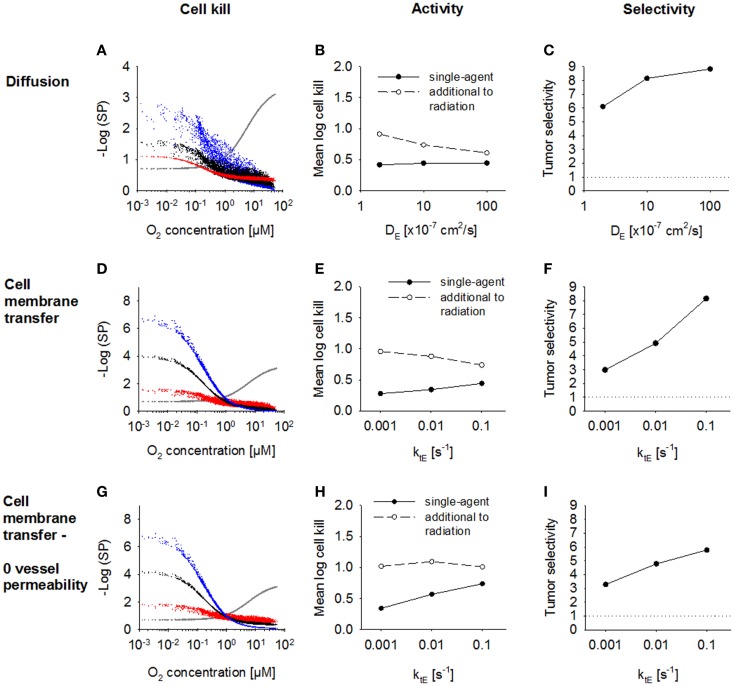
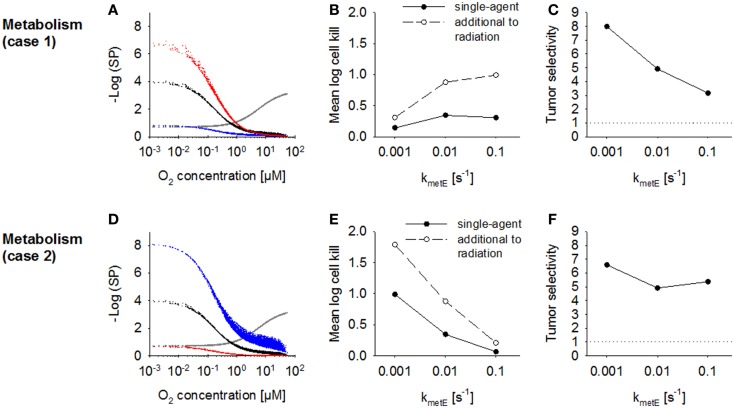
Hypoxia contributes to resistance of tumors to some cytotoxic drugs and to radiotherapy, but can in principle be exploited with hypoxia-activated prodrugs (HAP). HAP in clinical development fall into two broad groups. Class I HAP (like the benzotriazine N-oxides tirapazamine and SN30000), are activated under relatively mild hypoxia. In contrast, Class II HAP (such as the nitro compounds PR-104A or TH-302) are maximally activated only under extreme hypoxia, but their active metabolites (effectors) diffuse to cells at intermediate O2 and thus also eliminate moderately hypoxic cells. Here, we use a spatially resolved pharmacokinetic/pharmacodynamic (SR-PK/PD) model to compare these two strategies and to identify the features required in an optimal Class II HAP. The model uses a Green's function approach to calculate spatial and longitudinal gradients of O2, prodrug, and effector concentrations, and resulting killing in a digitized 3D tumor microregion to estimate activity as monotherapy and in combination with radiotherapy. An analogous model for a normal tissue with mild hypoxia and short intervessel distances (based on a cremaster muscle microvessel network) was used to estimate tumor selectivity of cell killing. This showed that Class II HAP offer advantages over Class I including higher tumor selectivity and greater freedom to vary prodrug diffusibility and rate of metabolic activation. The model suggests that the largest gains in class II HAP antitumor activity could be realized by optimizing effector stability and prodrug activation rates. We also use the model to show that diffusion of effector into blood vessels is unlikely to materially increase systemic exposure for realistic tumor burdens and effector clearances. However, we show that the tumor selectivity achievable by hypoxia-dependent prodrug activation alone is limited if dose-limiting normal tissues are even mildly hypoxic.
Keywords: PR-104; bystander effect; extravascular drug transport; hypoxia-activated prodrugs; pharmacokinetic/pharmacodynamic modeling; rational drug design; tirapazamine; tumor hypoxia.
Figures
Similar articles
-
The Role of Bystander Effects in the Antitumor Activity of the Hypoxia-Activated Prodrug PR-104.Front Oncol. 2013 Oct 7;3:263. doi: 10.3389/fonc.2013.00263. eCollection 2013. Front Oncol. 2013. PMID: 24109591 Free PMC article.
-
An Intratumor Pharmacokinetic/Pharmacodynamic Model for the Hypoxia-Activated Prodrug Evofosfamide (TH-302): Monotherapy Activity is Not Dependent on a Bystander Effect.Neoplasia. 2019 Feb;21(2):159-171. doi: 10.1016/j.neo.2018.11.009. Epub 2018 Dec 31. Neoplasia. 2019. PMID: 30591421 Free PMC article.
-
Oxygen dependence and extravascular transport of hypoxia-activated prodrugs: comparison of the dinitrobenzamide mustard PR-104A and tirapazamine.Int J Radiat Oncol Biol Phys. 2007 Oct 1;69(2):560-71. doi: 10.1016/j.ijrobp.2007.05.049. Int J Radiat Oncol Biol Phys. 2007. PMID: 17869669
-
Prospects for hypoxia-activated anticancer drugs.Curr Med Chem Anticancer Agents. 2004 Sep;4(5):395-9. doi: 10.2174/1568011043352812. Curr Med Chem Anticancer Agents. 2004. PMID: 15379691 Review.
-
Hypoxia Activated Prodrugs: Factors Influencing Design and Development.Curr Med Chem. 2015;22(37):4313-25. doi: 10.2174/0929867322666151021111016. Curr Med Chem. 2015. PMID: 26487420 Review.
Cited by
-
Tissue Pharmacokinetic Properties and Bystander Potential of Hypoxia-Activated Prodrug CP-506 by Agent-Based Modelling.Front Pharmacol. 2022 Feb 8;13:803602. doi: 10.3389/fphar.2022.803602. eCollection 2022. Front Pharmacol. 2022. PMID: 35211015 Free PMC article.
-
Combining hypoxia-activated prodrugs and radiotherapy in silico: Impact of treatment scheduling and the intra-tumoural oxygen landscape.PLoS Comput Biol. 2020 Aug 3;16(8):e1008041. doi: 10.1371/journal.pcbi.1008041. eCollection 2020 Aug. PLoS Comput Biol. 2020. PMID: 32745136 Free PMC article.
-
Towards personalized computational oncology: from spatial models of tumour spheroids, to organoids, to tissues.J R Soc Interface. 2018 Jan;15(138):20170703. doi: 10.1098/rsif.2017.0703. J R Soc Interface. 2018. PMID: 29367239 Free PMC article. Review.
-
Novel Prodrug Strategies for the Treatment of Tuberculosis.Chem Asian J. 2024 Dec 2;19(23):e202400944. doi: 10.1002/asia.202400944. Epub 2024 Oct 24. Chem Asian J. 2024. PMID: 39179514 Free PMC article. Review.
-
Multifaceted Interplay between Hormones, Growth Factors and Hypoxia in the Tumor Microenvironment.Cancers (Basel). 2022 Jan 21;14(3):539. doi: 10.3390/cancers14030539. Cancers (Basel). 2022. PMID: 35158804 Free PMC article. Review.
References
-
- Jamieson D, Wilson K, Pridgeon S, Margetts JP, Edmondson RJ, Leung HY, et al. NAD (P) H: quinone oxidoreductase 1 and NRH: quinone oxidoreductase 2 activity and expression in bladder and ovarian cancer and lower NRH: quinone oxidoreductase 2 activity associated with an NQO2 exon 3 single-nucleotide polymorphism. Clin Cancer Res (2007) 13:1584.10.1158/1078-0432.CCR-06-1416 - DOI - PubMed
Publication types
LinkOut - more resources
Full Text Sources
Other Literature Sources
Research Materials