. 2014 Mar 5;136(9):3491-504.
doi: 10.1021/ja411119m. Epub 2014 Jan 22.

High-resolution structures and orientations of antimicrobial peptides piscidin 1 and piscidin 3 in fluid bilayers reveal tilting, kinking, and bilayer immersion

Affiliations

High-resolution structures and orientations of antimicrobial peptides piscidin 1 and piscidin 3 in fluid bilayers reveal tilting, kinking, and bilayer immersion

B Scott Perrin Jr et al. J Am Chem Soc. .

Abstract

While antimicrobial peptides (AMPs) have been widely investigated as potential therapeutics, high-resolution structures obtained under biologically relevant conditions are lacking. Here, the high-resolution structures of the homologous 22-residue long AMPs piscidin 1 (p1) and piscidin 3 (p3) are determined in fluid-phase 3:1 phosphatidylcholine/phosphatidylglycerol (PC/PG) and 1:1 phosphatidylethanolamine/phosphatidylglycerol (PE/PG) bilayers to identify molecular features important for membrane destabilization in bacterial cell membrane mimics. Structural refinement of (1)H-(15)N dipolar couplings and (15)N chemical shifts measured by oriented sample solid-state NMR and all-atom molecular dynamics (MD) simulations provide structural and orientational information of high precision and accuracy about these interfacially bound α-helical peptides. The tilt of the helical axis, τ, is between 83° and 93° with respect to the bilayer normal for all systems and analysis methods. The average azimuthal rotation, ρ, is 235°, which results in burial of hydrophobic residues in the bilayer. The refined NMR and MD structures reveal a slight kink at G13 that delineates two helical segments characterized by a small difference in their τ angles (<10°) and significant difference in their ρ angles (~25°). Remarkably, the kink, at the end of a G(X)4G motif highly conserved among members of the piscidin family, allows p1 and p3 to adopt ρ angles that maximize their hydrophobic moments. Two structural features differentiate the more potent p1 from p3: p1 has a larger ρ angle and less N-terminal fraying. The peptides have comparable depths of insertion in PC/PG, but p3 is 1.2 Å more deeply inserted than p1 in PE/PG. In contrast to the ideal α-helical structures typically assumed in mechanistic models of AMPs, p1 and p3 adopt disrupted α-helical backbones that correct for differences in the amphipathicity of their N- and C-ends, and their centers of mass lie ~1.2-3.6 Å below the plane defined by the C2 atoms of the lipid acyl chains.


Figures

Figure 1
Figure 1
Orientation and bilayer position of an interfacially aligned peptide. (A) Orientation of a peptide that is kinked in the plane perpendicular to the bilayer surface. The angles (τNN) and (τCC) are used to characterize the orientations of the helical segments on the amino (left) and carboxyl (right) sides of the kink. (B) Bilayer location of the kinked peptide. The depth of insertion of the peptide is defined as the distance between the center of mass (CM) of the peptide backbone and the hydrophobic interface defined by the C2 of the bulk lipids (>10 Å from the nearest peptide). Since the peptide is kinked, a CM is defined for each helical segment before and after the kink (see Materials and Methods for details).
Figure 2
Figure 2
Helical wheel diagrams rotated to match the ρN and ρC of the refined NMR structures (NMRr; left set) or the MD structures (right set). In each set, p1 (left) and p3 (right) are shown in 3:1 PC/PG (top) and 1:1 PE/PG (bottom). Residues in green indicate more polar groups, while those in light orange are hydrophobic; histidines and glycine are in blue and gray, respectively. The orientation of the hydrophobic moment (μH) is identified with an orange arrow. The coordinate system that defines ρ is given in the Orientation from NMRr and MD Structures section.
Figure 3
Figure 3
2D de-HETCOR NMR spectra of p1 (left) and p3 (right) in oriented, hydrated 3:1 DMPC/DMPG (top) and 1:1 POPE/POPG (bottom). Spectral superimpositions of singly to triply labeled samples are shown. The peptide-to-lipid ratio was 1:20 (molar). The spectra were collected at 305 (1:1 POPE/POPG) and 313 K (3:1 DMPC/DMPG), above the phase transition temperature of the lipids. Each pair of 15N/1H splittings (DNH) is shown using a single color. In addition to 15N backbone amide labels, the arginine side chains also contained 15N sites, some of which were detected in the de-HETCOR spectra. Only the backbone signals are annotated. The de-HETCOR data for G22 p1, which are outside the range of the spectra shown here, and the PISEMA data for F6I9A12 p3 in DMPC/DMPG are included in Figure S2.
Figure 4
Figure 4
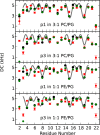
DC restraints experimentally observed (black), calculated from the refined NMR structures (green) and calculated from the MD simulations (red): p1 in 3:1 DMPC/DMPG (top) and 1:1 POPE/POPG (bottom-middle) and p3 in 3:1 DMPC/DMPG (top-middle) and 1:1 POPE/POPG (bottom). Absolute values of the dipolar couplings are plotted. Dynamics on the NMR time scale led to a lack of de-HETCOR signals for some of the terminal residues (Table S2). Dipolar waves fitted to the experimentally observed DC between residues 3–10 and 14–20 are shown in gray for an ideal α-helix with dihedral angles (ϕ = −61°, ψ = −45°). These α-helical regions are identified on the basis of having low fitting errors (average error per residue that is less than or similar to the experimental error of ±0.5 kHz).
Figure 5
Figure 5
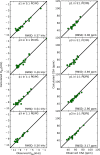
Correlation plots between calculated and experimental dipolar splittings, DNH (left) and CSA (right). Values calculated from the refined NMR structures are plotted as a function of the original NMR values. The rmsd for residues 3–20 are shown.
Figure 6
Figure 6
Ten lowest-energy backbone structures (left) and ribbon structures for the lowest-energy conformations (right) of p1 and p3 in 3:1 DMPC/DMPG and 1:1 POPE/POPG. These Xplor-NIH refined structures were calculated using ssNMR 15N chemical shifts and 15N/1H dipolar couplings. Peptides are aligned with the N-termini on the left. Considering residues 3–20 that show α-helicity, the rmsd values between the top 10 structures of each ensemble and their mean structures are 0.39 and 0.37 Å for p1 in PC/PG and PE/PG, respectively, and 0.39 and 0.35 Å for p3 in PC/PG and PE/PG, respectively (Table S5). Cross-correlation plots between experimental and calculated 1H–15N DNH and 15N CSA are shown in Figure 5. Three properties obtained from the MD simulations are included to show the average position of the C2 plane of the bulk lipids (horizontal blue line) relative to the fixed peptide: the z-position of the CM for backbone atoms of residues 3–10 and residues 14–20 (red dot); the average depth of insertion of the peptide (the distance between the blue line and red dot); and the fluctuations of the C2 plane with respect to the CM of the peptide (light blue horizontal band with thickness ±2rmsf = ±1.8 Å). Hence, the C2 plane fluctuates within the blue band with respect to the peptide.
Figure 7
Figure 7
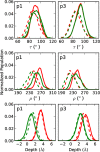
Distribution of tilt angles (top), azimuthal rotation angles (middle), and depths of insertion (bottom) sampled by p1 (left) or p3 (right) in PC/PG (red) or PE/PG (green) during the entire MD simulation (90 ns). Curves for N- and C-terminal residues are shown as solid and dashed lines, respectively.
Figure 8
Figure 8
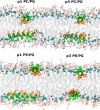
Snapshots of p1 and p3 in lipid bilayers from the MD simulations at a time step in which τN, τC, ρN, and ρC corresponded to the average orientations listed in Table 2. Hydrophobic residues are colored in orange, polar and charged residues in green, and the C2 atoms of the acyl chain in the lipids are indicated by cyan spheres. Two peptides were included in the simulations such that there was one peptide per leaflet, and the two peptides were oriented perpendicular to each other at the beginning of each simulation.
Figure 9
Figure 9
Hydrophobic moment (μH) versus Δρ for p1 (blue) and p3 (red) determined by rotating a helical wheel for residues 13–22 relative to a helical wheel for residues 1–12. Energies are from the White and Wimley interfacial hydrophobicity scale. Vertical gray band represent the range of Δρ calculated from the refined NMR and MD structures. The black line is positioned at Δρ = 0 (peptide with no kink).

Similar articles

Cited by

References

    1. Fjell C. D.; Hiss J. A.; Hancock R. E. W.; Schneider G. Nat. Rev. Drug Discov. 2012, 11, 37–51. - PubMed
    1. Mookherjee N.; Hancock R. E. W. Cell. Mol. Life Sci. 2007, 64, 922–933. - PMC - PubMed
    1. Haney E. F.; Hancock R. E. W. Biopolymers 2013, 6, 572–583. - PMC - PubMed
    1. Polyansky A. A.; Chugunov A. O.; Vassilevski A. A.; Grishin E. V.; Efremov R. G. Curr. Protein Pept. Sci. 2012, 13, 644–657. - PubMed
    1. Last N. B.; Schlamadinger D. E.; Miranker A. D. Protein Sci. 2013, 22, 870–882. - PMC - PubMed

Publication types

MeSH terms

LinkOut - more resources