. 2014 Feb 4;86(3):1744-52.
doi: 10.1021/ac403565m. Epub 2014 Jan 21.

Application of a high-resolution mass-spectrometry-based DNA adductomics approach for identification of DNA adducts in complex mixtures

Affiliations

Application of a high-resolution mass-spectrometry-based DNA adductomics approach for identification of DNA adducts in complex mixtures

Silvia Balbo et al. Anal Chem. .

Abstract

Liquid chromatography coupled with mass spectrometry (LC-MS) is the method of choice for analysis of covalent modification of DNA. DNA adductomics is an extension of this approach allowing for the screening for both known and unknown DNA adducts. In the research reported here, a new high-resolution/accurate mass MS(n) methodology has been developed representing an important advance for the investigation of in vivo biological samples and for the assessment of DNA damage from various human exposures. The methodology was tested and optimized using a mixture of 18 DNA adducts representing a range of biologically relevant modifications on all four bases and using DNA from liver tissue of mice exposed to the tobacco-specific nitrosamine 4-(methylnitrosamino)-1-(3-pyridyl)-1-butanone (NNK). In the latter experiment, previously characterized adducts, both expected and unexpected, were observed.


Figures

Figure 1
Figure 1
Structures of the DNA adducts in the mixture of standards, dR = 2′-deoxyribose.
Figure 2
Figure 2
Output of the high-resolution/accurate mass adductomic approach illustrated in the chromatograms and spectrum shown for O2-POB-dT from the standard mixture analysis. Panel A shows the MS3 scan event signifying detection of an adduct triggered by a mass difference of 116.0474 amu between an ion mass in the full scan (event shown in Panel C at 19.17 min) and an ion mass in the corresponding triggered MS2 spectrum (event shown in Panel B). Panel A.1 is the MS3 spectrum of O2-POB-dT. Panel C.1 is the accurate mass (5 ppm) extracted ion chromatogram of m/z = 390.1660 amu (O2-POB-dT) from the full scan spectra..
Figure 3
Figure 3
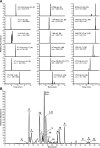
Chromatograms obtained upon analysis of a mixture of 18 DNA adducts (20 fmol of each). Panel A: each channel shows the full scan accurate mass extracted ion chromatogram of the DNA adducts. Panel B: chromatogram combining the extracted ion chromatograms of all 18 adducts.
Figure 4
Figure 4
Chromatograms obtained upon analysis of an HPLC fraction (fraction 9) from a human leukocyte DNA sample spiked with the mix of 18 standards. Panel A: total ion chromatogram (TIC) of the full scan data (250–600 amu) with high background signal from the sample matrix, which does not allow for clear identification of any peak. Panel B: extracted ion chromatogram (EIC) for O6-POB-dG at a mass tolerance typical of quadrupole and ion trap instruments (±0.2 amu). The peak corresponding to O6-POB-dG is not clearly distinguishable. Panel C: extracted ion chromatogram (EIC) for O6-POB-dG at a mass tolerance of 5 ppm. The DNA adduct peak is clearly identifiable.
Figure 5
Figure 5
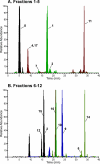
Extracted ion chromatograms (EIC) for standard mix adducts obtained upon analysis of the fractions obtained from the HPLC purification of a sample in which adducts were added to human leukocyte DNA. Numbers correspond to adduct identity (Figure 1). Panel A: superimposed EICs obtained from fractions 1–5. Panel B: superimposed EICs obtained from fraction 6–12. Each color refers to the single EIC.
Figure 6
Figure 6
Chromatograms obtained upon analysis of liver DNA from mice exposed to NNK. The figure shows the chromatograms of the adduct detected in the full scan by the MS3 signal (*) corresponding to the loss of 116.0474 amu. Panel A: POB adducts and their corresponding internal standards added before the DNA hydrolysis. Panel B: additional adducts detected in fractions 5, 6, and 9.

References

    1. Farmer P. B.; Singh R. Mutat. Res. 2008, 659, 68–76. - PubMed
    1. Tretyakova N.; Villalta P. W.; Kotapati S. Chem. Rev. 2013, 113, 2395–2436. - PMC - PubMed
    1. Rappaport S. M.; Li H.; Grigoryan H.; Funk W. E.; Williams E. R. Toxicol. Lett. 2012, 213, 83–90. - PMC - PubMed
    1. Bessette E. E.; Goodenough A. K.; Langouet S.; Yasa I.; Kozekov I. D.; Spivack S. D.; Turesky R. J. Anal. Chem. 2009, 81, 809–819. - PMC - PubMed
    1. Chou P. H.; Kageyama S.; Matsuda S.; Kanemoto K.; Sasada Y.; Oka M.; Shinmura K.; Mori H.; Kawai K.; Kasai H.; Sugimura H.; Matsuda T. Chem. Res. Toxicol. 2010, 23, 1442–1448. - PubMed

Publication types

Substances