. 2014 Jan 10:12:4.
doi: 10.1186/1478-811X-12-4.

FTO contributes to hepatic metabolism regulation through regulation of leptin action and STAT3 signalling in liver

Affiliations

FTO contributes to hepatic metabolism regulation through regulation of leptin action and STAT3 signalling in liver

Amélie Bravard et al. Cell Commun Signal. .

Abstract

Background: The fat mass and obesity associated (FTO) gene is related to obesity and type 2 diabetes, but its function is still largely unknown. A link between leptin receptor-signal transducers and activators of transcription 3 (LepR-STAT3) signalling pathway and FTO was recently suggested in the hypothalamus. Because of the presence of FTO in liver and the role of LepR-STAT3 in the control of hepatic metabolism, we investigated both in vitro and in vivo the potential interrelationship between FTO and LepR-STAT3 signalling pathway in liver and the impact of FTO overexpression on leptin action and glucose homeostasis in liver of mice.

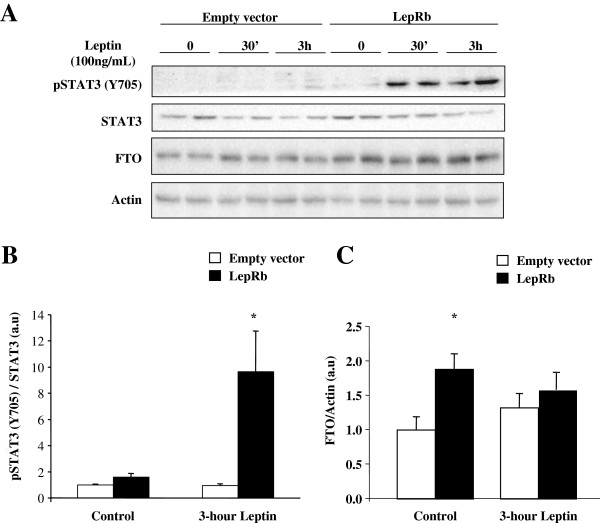
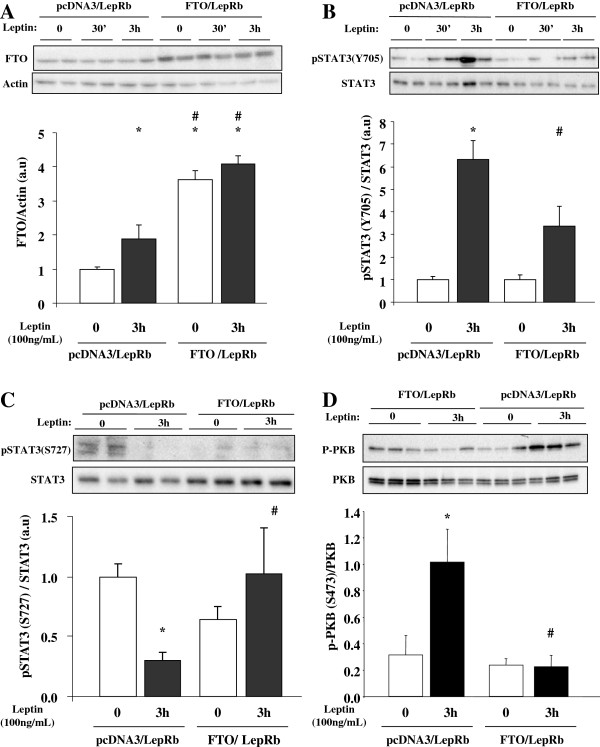
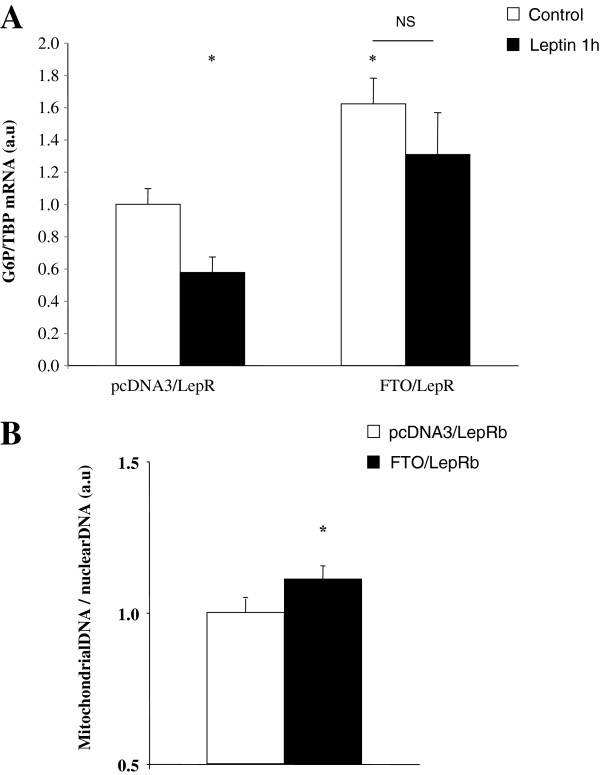
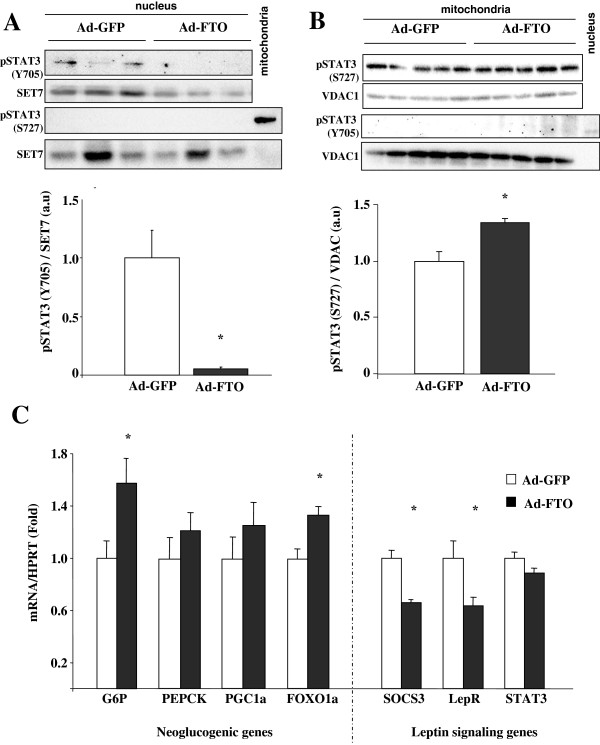
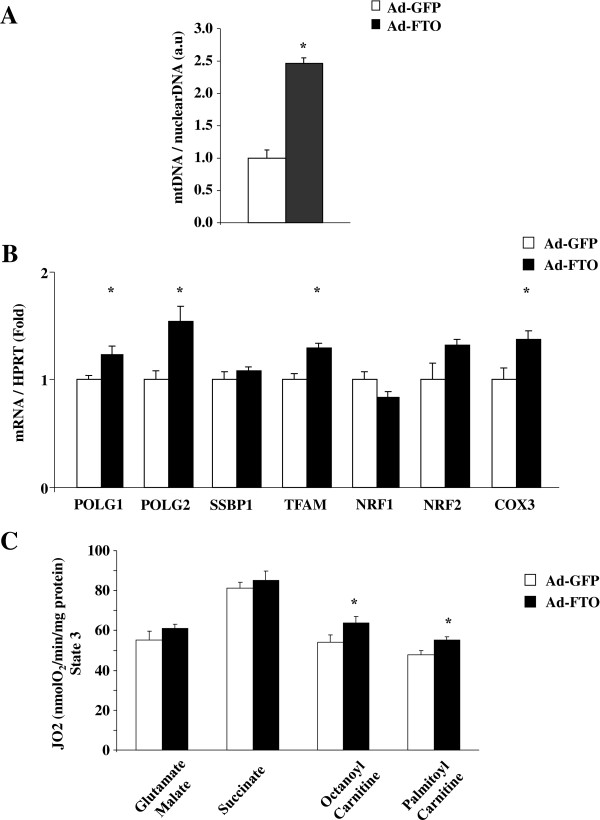
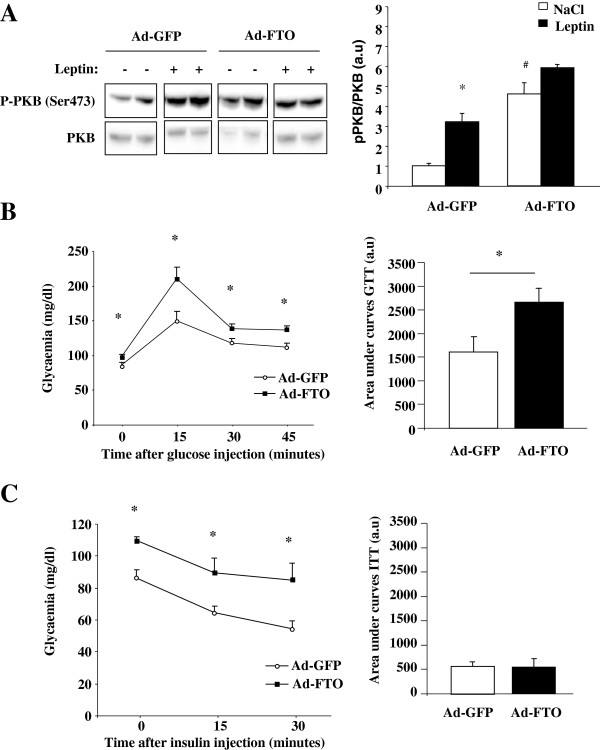
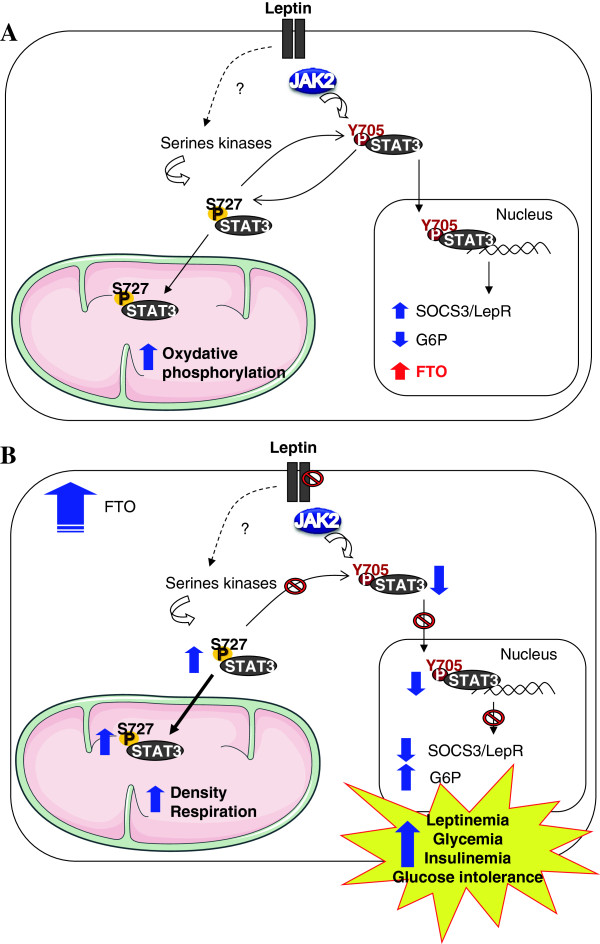
Results: We found that FTO protein expression is regulated by both leptin and IL-6, concomitantly to an induction of STAT3 tyrosine phosphorylation, in leptin receptor (LepRb) expressing HuH7 cells. In addition, FTO overexpression in vitro altered both leptin-induced Y705 and S727 STAT3 phosphorylation, leading to dysregulation of glucose-6-phosphatase (G6P) expression and mitochondrial density, respectively. In vivo, liver specific FTO overexpression in mice induced a reducetion of Y705 phosphorylation of STAT3 in nuclear fraction, associated with reduced SOCS3 and LepR mRNA levels and with an increased G6P expression. Interestingly, FTO overexpression also induced S727 STAT3 phosphorylation in liver mitochondria, resulting in an increase of mitochondria function and density. Altogether, these data indicate that FTO promotes mitochondrial recruitment of STAT3 to the detriment of its nuclear localization, affecting in turn oxidative metabolism and the expression of leptin-targeted genes. Interestingly, these effects were associated in mice with alterations of leptin action and hyperleptinemia, as well as hyperglycemia, hyperinsulinemia and glucose intolerance.

Conclusions: Altogether, these data point a novel regulatory loop between FTO and leptin-STAT3 signalling pathways in liver cells, and highlight a new role of FTO in the regulation of hepatic leptin action and glucose metabolism.


Figures

Figure 1
Figure 1
Leptin regulates STAT3 signalling and FTO expression in HuH-7 cells. HuH7 cells were transfecting with pcDNA3-LepRb and empty pcDNA3 vectors for 36 hours. Cells were then serum starved for 16 hours before leptin stimulation (100 ng/mL) during the indicated periods. A) Representative Western Blots of pSTAT3(Y705) and total STAT3, as well as FTO and actin proteins, in HuH-7 cells expressing LepRb treated with leptin (100 ng/mL). B-C) Quantitative analysis of both Y705 phosphorylation of STAT3 B) and FTO expression C) in 3-hour leptin treated transfected HuH7 cells, showing that B) leptin increases Y705 phosphorylation of STAT3 in LepRb expressing HuH7 cells, and that C) the overexpression of LepRb induces FTO protein levels. Data are means ± SEM (n = 6/group). *p < 0.05 compared to control transfected cells. LepRb: leptin receptor; STAT3: signal transducer and activator of transcription 3; FTO: fat-mass and obesity associated gene.
Figure 2
Figure 2
IL-6 regulates STAT3 signaling and FTO expression in HuH7 cells. HuH7 cells were depleted for 16 hours of serum and treated with IL-6 (10 ng/ml) during different times. A) Representative Western blots and quantitative analysis of Y705 phosphorylation of STAT3 in HuH-7 cells treated with IL-6 (10 ng/ml), showing that IL-6 stimulates tyrosine phosphorylation of STA3 in a time-dependant manner in HuH7 cells expressing LepRb. B) Representative Western blots and quantitative analysis of FTO expression in HuH7 cells treated with IL-6, showing that IL-6 stimulates FTO protein levels in HuH7 cells expressing LepRb. Data are means ± SEM (n = 4/group).*p < 0.05 compared to untreated cells.
Figure 3
Figure 3
FTO regulates the LepRb-STAT3 signalling pathway in co-transfected HuH7 cells. HuH7 cells were co-transfecting with both LepRb and FTO vectors (empty vector as control) for 36 hours. Cells were then serum starved for 16 hours before three-hour leptin stimulation (100 ng/mL). A) Representative Western blots and quantitative analysis of FTO expression in co-transfected HuH7 cells, validating the FTO overexpression. B) Representative Western blots and quantitative analysis of pSTAT3(Y705) and total STAT3 in co-transfected HuH7 cells, showing that FTO represses the leptin-induced STAT3 tyrosine phosphorylation. C) Representative Western blots of pSTAT3(S727) and total STAT3 in co-transfected cells, showing that FTO represses the leptin-mediated reduction of serine phosphorylation of STAT3. D) Representative Western blots and quantitative analysis of pPKB(S473) and PKB proteins in co-tranfected HuH7 cells, showing that FTO represses the leptin-induced PKB phosphorylation. Data are means ± SEM (n = 3-6/group). *p < 0.05 compared to untreated control cells. #p < 0.05 compared to treated control cells.
Figure 4
Figure 4
FTO regulates downstream events of activated STAT3 in co-transfected HuH7 cells. HuH7 cells were co-transfecting with both LepRb and FTO vectors (empty vector as control) for 36 hours. Cells were then serum starved for 16 hours before three-hour leptin stimulation (100 ng/mL). A) Effect of FTO overexpression on G6P mRNA levels of leptin-stimulated co-transfected HuH7cells, measured by real-time RT-PCR and expressed relative to untreated control co-transfected HuH7 cells. B) Effect of FTO overexpression on mtDNA amount of co-transfected HuH7 cells. Data are means ± SEM (n = 6/group). *p < 0.05 compared to untreated control cells A) or to mock transfected cells B). G6P: Glucose 6 phosphatase. TBP: TATA box binding protein.
Figure 5
Figure 5
Overexpression of FTO in liver of mice disruptsSTAT3 pathway. FTO was overexpressed in liver of mice by adenoviral infection using a recombinant adenovirus encoding human FTO or GFP (as control) proteins for 10 days (2.108ifu/g of body weight). A) Representative Western blots and quantitative analysis of pSTAT3(Y705) and SET7 proteins in nuclear fractions of liver infected with a recombinant adenovirus encoding human FTO or GFP (as control) proteins for 10 days. Controls with a marker of mitochondrial fractions illustrate that pS-STAT3 is nor present in nucleus fractions. B) Representative Western blots and quantitative analysis of pSTAT3(S727) and VDAC in mitochondrial fractions of infected liver. Controls with a marker of nucleus fractions illustrate that pY-STAT3 is nor present in mitochondrial fractions. C) mRNA levels of G6P, PEPCK, PGC1α and FOXO1α determined by real-time PCR in liver of Ad-GFP and Ad-FTO mice and expressed relative to Ad-GFP mice Data are means ± SEM (n = 4/group for A and n = 6/group for B). *p < 0.05 compared to Ad-GFP mice.
Figure 6
Figure 6
FTO overexpression in liver of mice regulates mitochondrial density and funtion. Liver of mice were infected with recombinant adenovirus encoding human FTO or GFP (control) proteins for 10 days (2.108ifu/g of body weight). A) Effect of FTO on mtDNA quantity, calculated as the ratio of COX1 to cyclophilin A DNA levels, and measured by real-time PCR in the liver of infected mice. B) Effect of FTO on the mRNA levels of POLG1, POLG2, SSBP1, TFAM, NRF1, NRF2, COX3 measured by real-time PCR in the liver of Ad-GFP and Ad-FTO mice. C) Effect of FTO on oxygen consumption of mitochondria isolated from liver of Ad-GFP and Ad-FTO mice. Data are means ± SEM (n = 5/group). *p < 0.05 compared to GFP infected mice.
Figure 7
Figure 7
FTO overexpression in liver of mice affects leptin action and glucose homeostasis. Liver of mice were infected with recombinant adenovirus encoding human FTO or GFP (control) proteins for 10 days (2.108ifu/g of body weight). A) After an overnight fasting, infected mice were treated by ip injection with leptin (1 μg/g) for 30 minutes. Representative Western blots and quantitative analysis of pPKB(S473) and PKB proteins in liver of leptin-treated infected mice. Note that four parts of a same gel were shown. B) Glucose tolerance test performed after 6 hours of fasting on infected mice and corresponding quantitative analysis of area under curves. B) Insulin tolerance test performed after 6 hours of fasting on infected mice and corresponding quantitative analysis of area under curves. Data are means ± SEM (n = 3/group for A and n = 8/group for B-C). *p < 0.05 compared to GFP infected mice.
Figure 8
Figure 8
Model of FTO regulation of leptin action and glucose homeostasis through the LepRb-STAT3 signaling pathway. A) The binding of leptin to its receptor triggers the activation of JAK2 and the phosphorylation of STAT3 on a tyrosine residue (Y705). This modification causes the STAT3 protein to relocate to the nucleus, where as a dimer, it regulates gene expression (upregulation of both SOCS3 and LepR and reduction of G6P). Our data further suggest that FTO could be a STAT3-upregulated gene in hepatocytes. B) FTO overexpression reduces Y705 STAT3 phosphorylation, reducing its nuclear translocation and leading to a downregulation of both SOCS3 and LepRb and an upregulation of G6P mRNA levels. Just to opposite, FTO overexpression induces S727 phosphorylation of STAT3, favorizing its mitochondrial localization, where it induces mitochondrial density and function. All these effects are associated in vivo with hyperleptinemia, hyperglycemia, hyperleptinemia and glucose intolerance. Altogether, these data indicate that FTO controls leptin action and glucose metabolism in liver.

Similar articles

Cited by

References

    1. Tung YC, Yeo GS. From GWAS to biology: lessons from FTO. Ann N Y Acad Sci. 2011;1220:162–171. doi: 10.1111/j.1749-6632.2010.05903.x. - DOI - PubMed
    1. Berulava T, Horsthemke B. The obesity-associated SNPs in intron 1 of the FTO gene affect primary transcript levels. Eur J Hum Genet. 2010;18:1054–1056. doi: 10.1038/ejhg.2010.71. - DOI - PMC - PubMed
    1. Bravard A, Lefai E, Meugnier E, Pesenti S, Disse E, Vouillarmet J, Peretti N, Rabasa-Lhoret R, Laville M, Vidal H, Rieusset J. FTO is increased in muscle during type 2 diabetes, and its overexpression in myotubes alters insulin signaling, enhances lipogenesis and ROS production, and induces mitochondrial dysfunction. Diabetes. 2011;60:258–268. doi: 10.2337/db10-0281. - DOI - PMC - PubMed
    1. Bravard A, Veilleux A, Disse E, Laville M, Vidal H, Tchernof A, Rieusset J. The expression of FTO in human adipose tissue is influenced by fat depot, adiposity, and insulin sensitivity. Obesity (Silver Spring) 2013;21:1165–1173. doi: 10.1002/oby.20110. - DOI - PubMed
    1. Church C, Lee S, Bagg EA, McTaggart JS, Deacon R, Gerken T, Lee A, Moir L, Mecinovic J, Quwailid MM. et al.A mouse model for the metabolic effects of the human fat mass and obesity associated FTO gene. PLoS Genet. 2009;5:e1000599. doi: 10.1371/journal.pgen.1000599. - DOI - PMC - PubMed

Publication types

MeSH terms

LinkOut - more resources