

Cytogenomic mapping and bioinformatic mining reveal interacting brain expressed genes for intellectual disability
- PMID: 24410907
- PMCID: PMC3905969
- DOI: 10.1186/1755-8166-7-4
Cytogenomic mapping and bioinformatic mining reveal interacting brain expressed genes for intellectual disability
Abstract
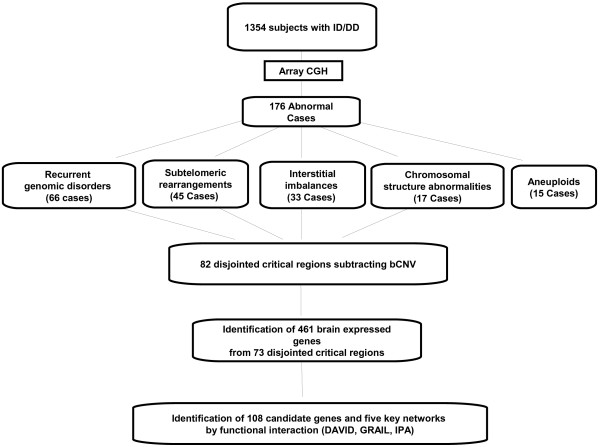
Background: Microarray analysis has been used as the first-tier genetic testing to detect chromosomal imbalances and copy number variants (CNVs) for pediatric patients with intellectual and developmental disabilities (ID/DD). To further investigate the candidate genes and underlying dosage-sensitive mechanisms related to ID, cytogenomic mapping of critical regions and bioinformatic mining of candidate brain-expressed genes (BEGs) and their functional interactions were performed. Critical regions of chromosomal imbalances and pathogenic CNVs were mapped by subtracting known benign CNVs from the Databases of Genomic Variants (DGV) and extracting smallest overlap regions with cases from DatabasE of Chromosomal Imbalance and Phenotype in Humans using Ensembl Resources (DECIPHER). BEGs from these critical regions were revealed by functional annotation using Database for Annotation, Visualization, and Integrated Discovery (DAVID) and by tissue expression pattern from Uniprot. Cross-region interrelations and functional networks of the BEGs were analyzed using Gene Relationships Across Implicated Loci (GRAIL) and Ingenuity Pathway Analysis (IPA).
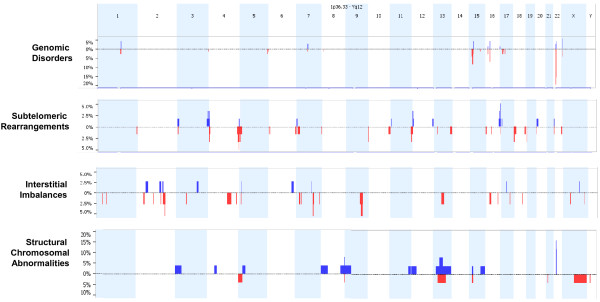
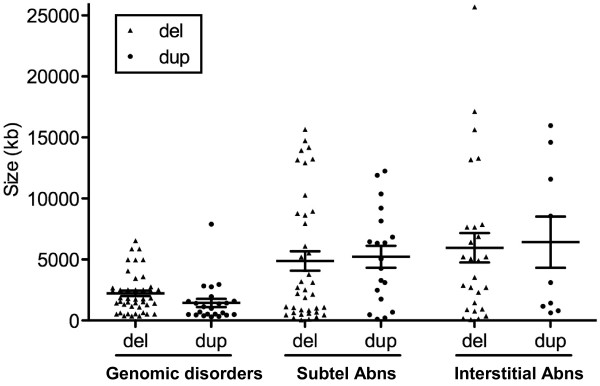
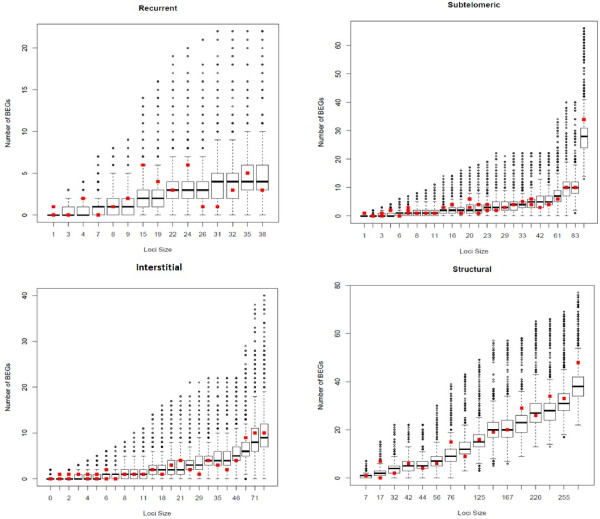
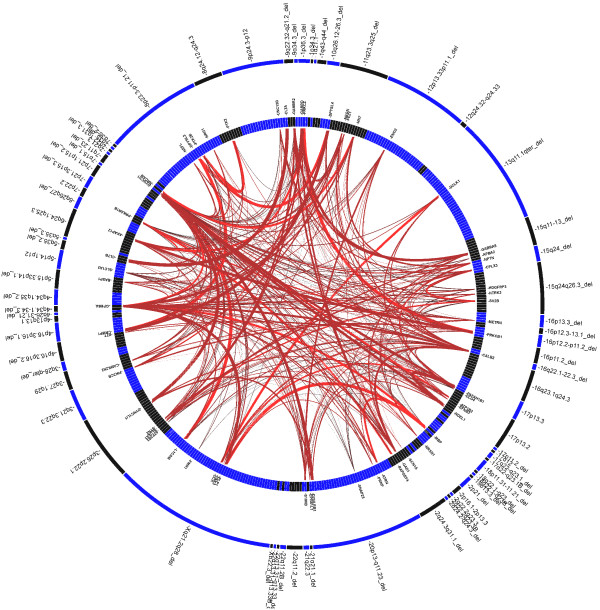
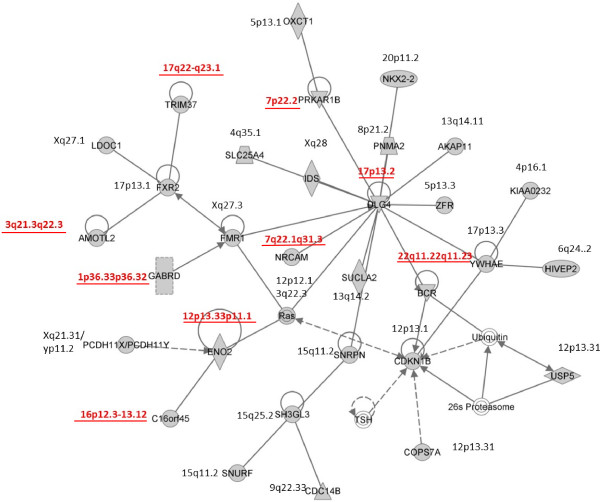
Results: Of the 1,354 patients analyzed by oligonucleotide array comparative genomic hybridization (aCGH), pathogenic abnormalities were detected in 176 patients including genomic disorders in 66 patients (37.5%), subtelomeric rearrangements in 45 patients (25.6%), interstitial imbalances in 33 patients (18.8%), chromosomal structural rearrangements in 17 patients (9.7%) and aneuploidies in 15 patients (8.5%). Subtractive and extractive mapping defined 82 disjointed critical regions from the detected abnormalities. A total of 461 BEGs was generated from 73 disjointed critical regions. Enrichment of central nervous system specific genes in these regions was noted. The number of BEGs increased with the size of the regions. A list of 108 candidate BEGs with significant cross region interrelation was identified by GRAIL and five significant gene networks involving cell cycle, cell-to-cell signaling, cellular assembly, cell morphology, and gene expression regulations were denoted by IPA.
Conclusions: These results characterized ID related cross-region interrelations and multiple networks of candidate BEGs from the detected genomic imbalances. Further experimental study of these BEGs and their interactions will lead to a better understanding of dosage-sensitive mechanisms and modifying effects of human mental development.
Figures
References
-
- Miller DT, Adam MP, Aradhya S, Biesecker LG, Brothman AR, Carter NP, Church DM, Crolla JA, Eichler EE, Epstein CJ. et al. Consensus statement: chromosomal microarray is a first-tier clinical diagnostic test for individuals with developmental disabilities or congenital anomalies. Am J Hum Genet. 2010;86:749–764. doi: 10.1016/j.ajhg.2010.04.006. - DOI - PMC - PubMed
-
- Xiang B, Li A, Valentin D, Nowak NJ, Zhao H, Li P. Analytical and clinical validity of whole-genome oligonucleotide array comparative genomic hybridization for pediatric patients with mental retardation and developmental delay. Am J Med Genet A. 2008;146A:1942–1954. doi: 10.1002/ajmg.a.32411. - DOI - PubMed
-
- Hayashi S, Imoto I, Aizu Y, Okamoto N, Mizuno S, Kurosawa K, Honda S, Araki S, Mizutani S, Numabe H. et al. Clinical application of array-based comparative genomic hybridization by two-stage screening for 536 patients with mental retardation and multiple congenital anomalies. J Hum Genet. 2010;56:110–124. - PubMed
LinkOut - more resources
Full Text Sources
Other Literature Sources
