. 2014 Feb;14(2):284-94.
doi: 10.1111/ajt.12596. Epub 2014 Jan 10.

Key role for CD4 T cells during mixed antibody-mediated rejection of renal allografts

Affiliations

Key role for CD4 T cells during mixed antibody-mediated rejection of renal allografts

A Gaughan et al. Am J Transplant. 2014 Feb.

Abstract

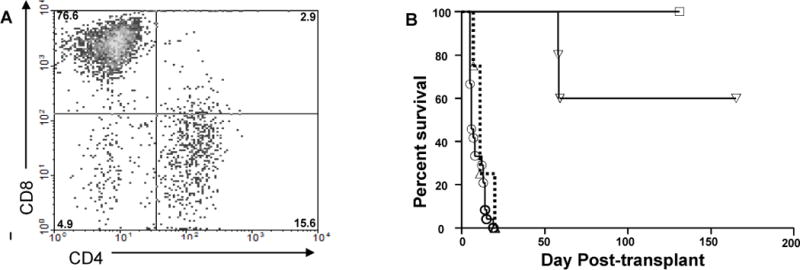
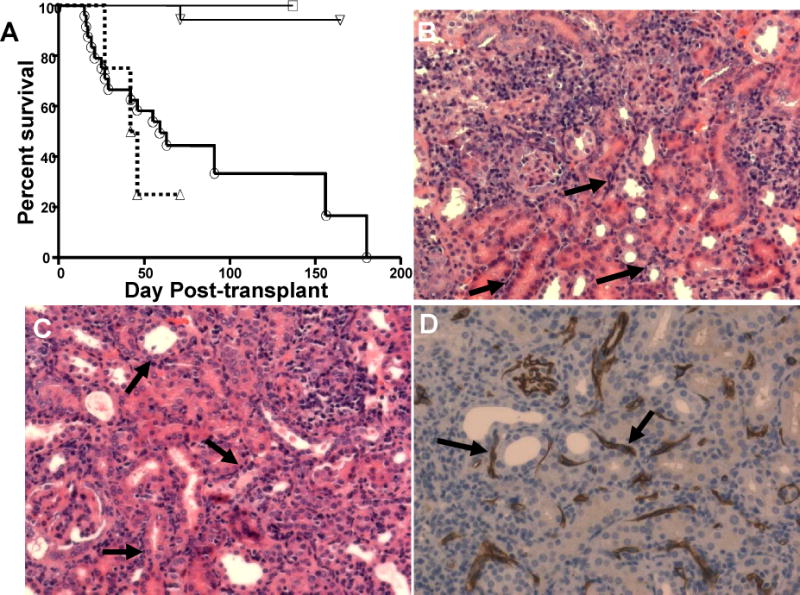
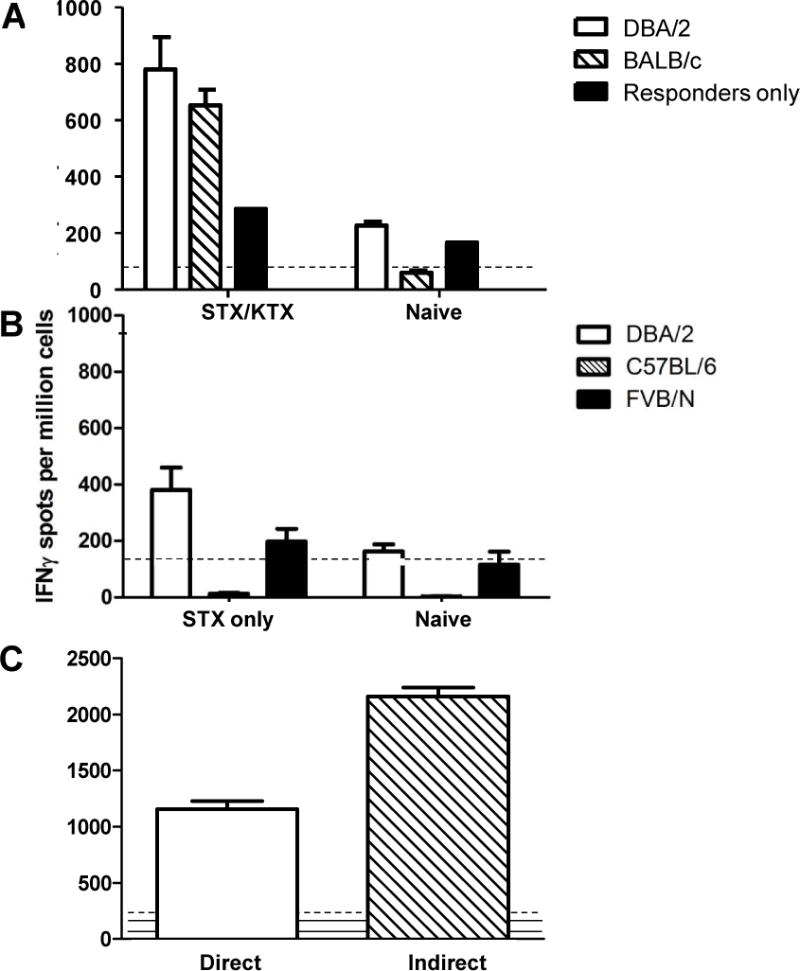
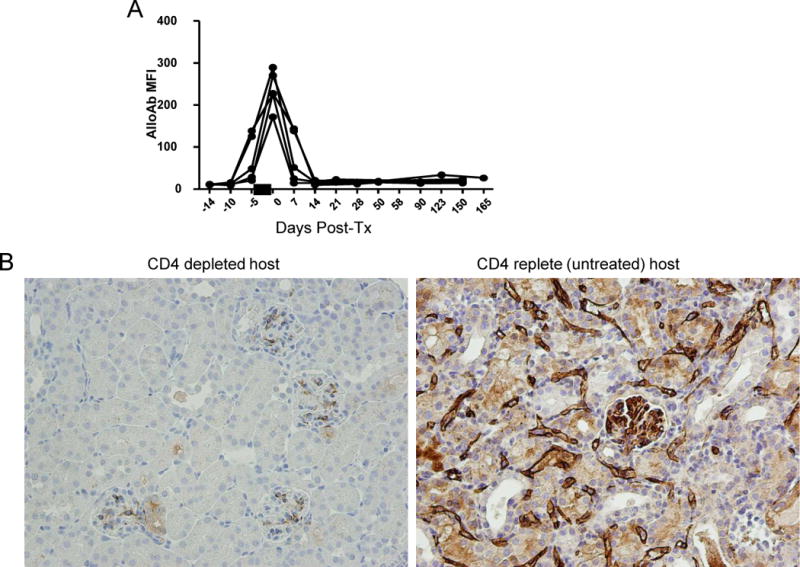
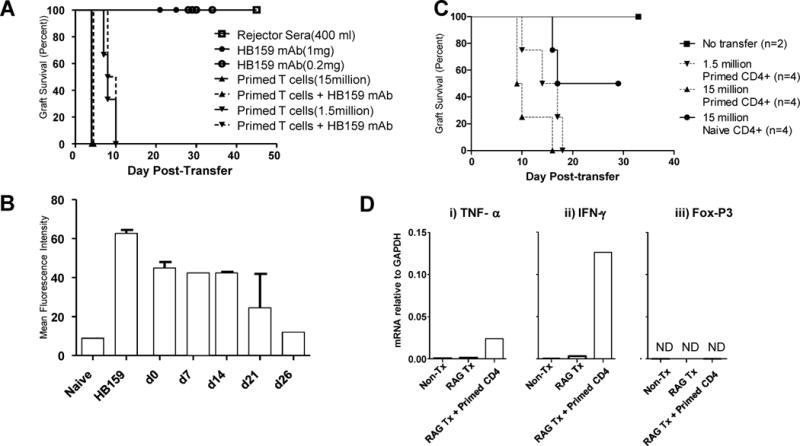
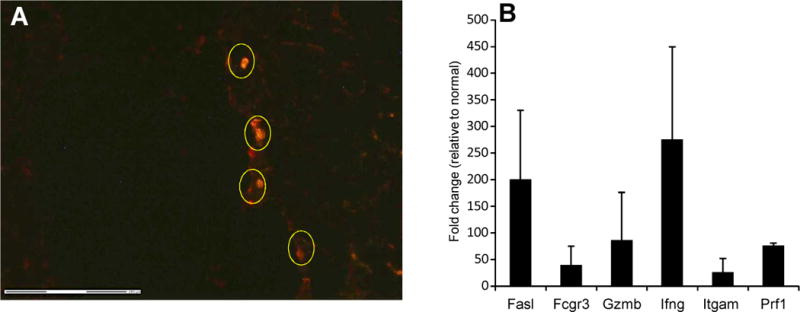
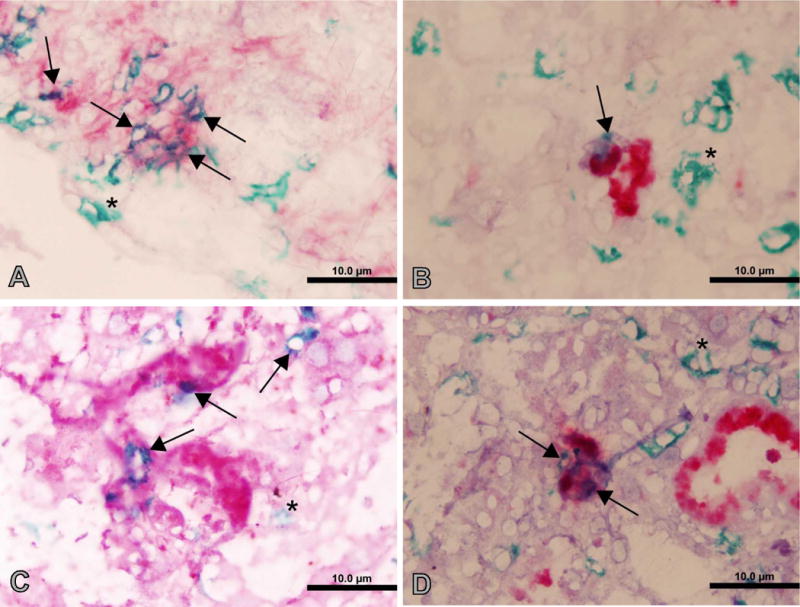
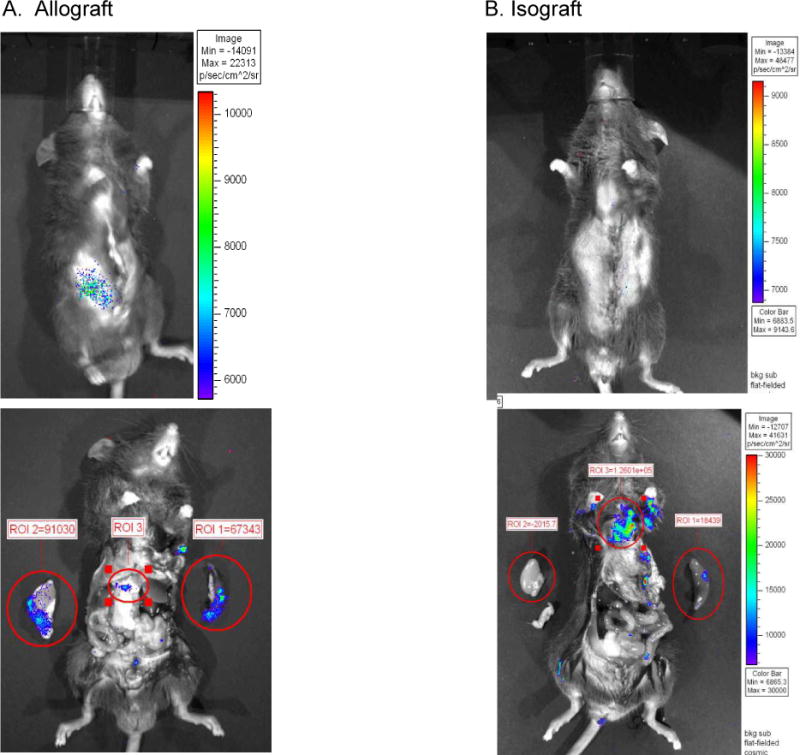
We utilized mouse models to elucidate the immunologic mechanisms of functional graft loss during mixed antibody-mediated rejection of renal allografts (mixed AMR), in which humoral and cellular responses to the graft occur concomitantly. Although the majority of T cells in the graft at the time of rejection were CD8 T cells with only a minor population of CD4 T cells, depletion of CD4 but not CD8 cells prevented acute graft loss during mixed AMR. CD4 depletion eliminated antidonor alloantibodies and conferred protection from destruction of renal allografts. ELISPOT revealed that CD4 T effectors responded to donor alloantigens by both the direct and indirect pathways of allorecognition. In transfer studies, CD4 T effectors primed to donor alloantigens were highly effective at promoting acute graft dysfunction, and exhibited the attributes of effector T cells. Laser capture microdissection and confirmatory immunostaining studies revealed that CD4 T cells infiltrating the graft produced effector molecules with graft destructive potential. Bioluminescent imaging confirmed that CD4 T effectors traffic to the graft site in immune replete hosts. These data document that host CD4 T cells can promote acute dysfunction of renal allografts by directly mediating graft injury in addition to facilitating antidonor alloantibody responses.

Keywords: Adoptive transfer; ELISPOT; T cell-mediated rejection; antibody-mediated rejection; graft infiltrating lymphocytes.


Conflict of interest statement

Disclosures

The authors of this manuscript have no conflicts of interest to disclose as described by the American Journal of Transplantation.

Figures

Figure 1
Figure 1
Host CD4 T cells represent a minority of T cells infiltrating renal allografts but play a dominant role in promoting acute graft dysfunction. C57Bl/6 mice were primed with DBA/2 skin allografts then received DBA/2 renal allografts as described in Materials and Methods. A. Cells from grafts undergoing rejection (serum creatinine > 70 mmol/L) were isolated and subjected to multicolor FACS analysis using mAbs to CD3, CD4, and CD8. Numbers in each quadrant represent percentages of total CD3+ T lymphocytes. Data are representative of four independent experiments. B. Primed C57BL/6 recipients received DBA/2 renal allografts and were either untreated (●, n=24) or depleted of CD8 T cells (▲, n=9) or CD4 T cells (▼, n=16) at the time of transplantation.
Figure 2
Figure 2
Mixed AMR in non-primed renal allograft recipients. (A.) Survival of BALB/c renal allografts in naïve C57BL/6 (B6) recipients. Experimental group indicators as for Figure 1B. Rejected renal allografts (BALB/c->B6) were harvested at the time of rejection. (B and C) H&E sections demonstrate focal inflammatory cell infiltrates, peri-tubular capillary (PTC) margination (arrows), H&E, 200×. (D) C4d in PTC (arrows) as detected by immunoperoxidase staining. Data are representative of four or more grafts.
Figure 3
Figure 3
Sensitization to donor alloantigens followed by renal transplantation increases the frequency of donor-reactive CD4 T cells. A. Purified splenic CD4 T cells from B6 hosts that had rejected both renal and skin allografts from DBA/2 donors (STX/RTX) or from naïve recipients (Naïve) were tested in an IFNG ELISPOT assay against the indicated targets. B. Purified splenic CD4 T cells from B6 hosts that had rejected DBA/2 skin allografts only (STX only) or from normal B6 hosts (Naïve) were tested in an IFNG ELISPOT assay for reactivity to B6 (syngeneic), DBA/2 (allogeneic), or FVB/N (third party) SC targets. C. Unseparated SC from primed B6 hosts at the time of rejection of DBA/2 renal allografts were tested in an IFNG ELISPOT assay against either intact (direct) or subcellular (indirect) irradiated stimulator cells. Data shown are the mean (+ SEM) IFNG spots per million cells. Dashed lines show reactivity of stimulators only; solid lines show reactivity of responders only.
Figure 4
Figure 4
Antibody responses in CD4 depleted recipients. A. Sera were collected from skin primed recipients (n=5) at the indicated times post-transplantation and tested for reactivity to DBA/2 splenocytes. IgG binding was detected by the mean fluorescence intensity (MFI) of fluorochrome conjugated anti-mouse IgG for each sample. Each line represents a single recipient mouse. The black bar indicates the time of CD4 depletion (days −3, −2, −1). B. Immunostaining for C3d deposition in peritubular capillaries (PTC) (arrows).
Figure 5
Figure 5
Primed CD4 T cells promote acute destruction of renal allografts. A. Rag−/− mice received DBA/2 renal allografts and after one week were injected intravenously with sera from WT mice that had rejected DBA/2 renal allografts (squares), HB159 monoclonal antibody (circles), or donor-primed T cells (triangles). B. Sera from RAG−/− recipients of DBA/2 renal allografts and HB159 mAb were collected at the indicated times post transplantation, diluted 1:16 and then tested for reactivity to DBA/2 splenocytes. C. Rag−/− mice received DBA/2 renal allografts and after one week were injected intravenously with 15 million naïve CD4+ T cells (solid line, circle) or with primed CD4+ T cells at a dose of 1.5 million (inverted triangle, dashed line)or 15 million (triangle, dashed line). D. Renal allografts were retrieved at the time of rejection in RAG−/− recipients receiving no (RAG TX) or 15 million primed CD4+ T cells (RAG TX + Primed CD4) and RNA isolated from total graft homogenates was analyzed by qRT-PCR to determine the indicated mRNA levels. Negative controls included RNA from normal DBA/2 kidneys (NON-TX); positive controls included RNA from grafts transplanted into primed wildtype recipients (WT TX) undergoing mixed AMR. Data shown in D are mRNA levels relative to GAPDH; Not detected (ND).
Figure 6
Figure 6
Graft infiltrating CD4 T cells produce mRNA for effector cytokines. RAG KO mice received DBA/2 renal allografts and after one week were injected intravenously with 15 million donor primed purified CD4+ T cells from CD8 KO donors on the C57Bl/6 background that had previously rejected DBA/2 skin allografts. For laser capture microdissection (LCM), CD4+ cells were identified using anti-CD4 antibody followed by captures. RNA was then isolated from CD4+ cells in the graft (A) and analyzed by qRT-PCR to determine mRNA levels (B). Data shown in B are normalized to values obtained for kidneys from non-transplanted DBA/2 mice. C) Cytotoxicity of purified CD4 or CD8 T cells from normal and skin grafted C57BL6 mice to Con A blast targets of DBA/2 or C57BL/6 origin.
Figure 7
Figure 7
Immunohistochemistry of graft infiltrating CD4 cells. A rejecting renal allograft was stained with anti-CD4 (green) in combination with antibodies to Fasl (A), granzyme B (B), IFNγ (C), or perforin (D) (red). Singly stained CD4 cells are indicated by arrows; doubly stained cells are indicated by astericks.
Figure 8
Figure 8
Bioluminescent imaging of CD4+ T cells. Splenic CD4 T cells were isolated from skin primed L2G85.B6 donors and injected intravenously into previously skin primed congenic B6 recipients. Within 24 hours after injection recipients received a DBA/2 renal allograft (A) or a B6 renal isograft (B). Five days after transplant, whole body imaging revealed bioluminescent signal detectable from the renal allograft but not the isograft. Data shown are a whole body image (upper) and an image of exposed organs (lower). The scale to the right of the images indicates the photon count (and hence the relative numbers of CD4 T cells) designated by the different colors. Boxes show relative light emission values (proportional to cell abundance) obtained for the circled regions of interest (ROI) which included the graft, spleen, and other secondary lymphoid organs.

Similar articles

Cited by

References

    1. Baldwin WM, 3rd, Valujskikh A, Fairchild RL. Antibody-mediated rejection: emergence of animal models to answer clinical questions. Am J Transplant. 2010 May;10(5):1135–42. Epub 2010/03/30. eng. - PMC - PubMed
    1. Collins AB, Schneeberger EE, Pascual MA, Saidman SL, Williams WW, Tolkoff-Rubin N, et al. Complement activation in acute humoral renal allograft rejection: diagnostic significance of C4d deposits in peritubular capillaries. J Am Soc Nephrol. 1999 Oct;10(10):2208–14. Epub 1999/10/03. eng. - PubMed
    1. Bohmig GA, Exner M, Habicht A, Schillinger M, Lang U, Kletzmayr J, et al. Capillary C4d deposition in kidney allografts: a specific marker of alloantibody-dependent graft injury. J Am Soc Nephrol. 2002 Apr;13(4):1091–9. Epub 2002/03/26. eng. - PubMed
    1. Nakashima S, Qian Z, Rahimi S, Wasowska BA, Baldwin WM., 3rd Membrane attack complex contributes to destruction of vascular integrity in acute lung allograft rejection. J Immunol. 2002 Oct 15;169(8):4620–7. Epub 2002/10/09. eng. - PubMed
    1. Colvin RB. Antibody-mediated renal allograft rejection: diagnosis and pathogenesis. J Am Soc Nephrol. 2007 Apr;18(4):1046–56. Epub 2007/03/16. eng. - PubMed

Publication types

MeSH terms