. 2014 Jan 7;106(1):182-9.
doi: 10.1016/j.bpj.2013.11.1121.

Transient potential gradients and impedance measures of tethered bilayer lipid membranes: pore-forming peptide insertion and the effect of electroporation

Affiliations

Transient potential gradients and impedance measures of tethered bilayer lipid membranes: pore-forming peptide insertion and the effect of electroporation

Charles G Cranfield et al. Biophys J. .

Abstract

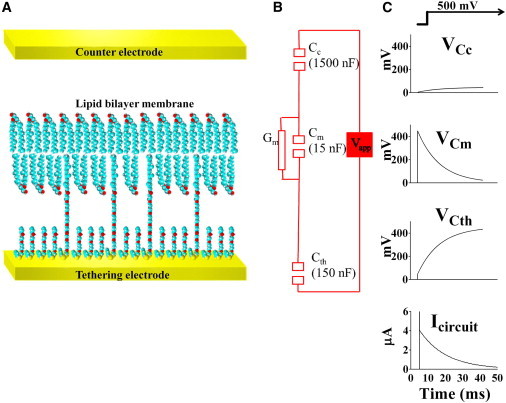
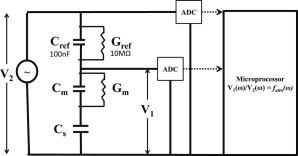
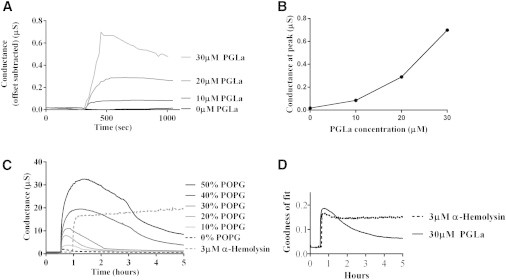
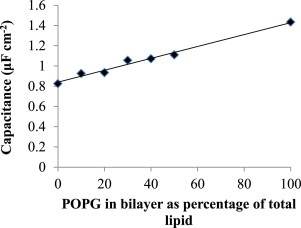
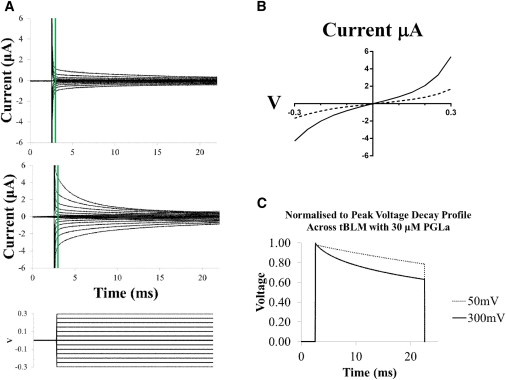
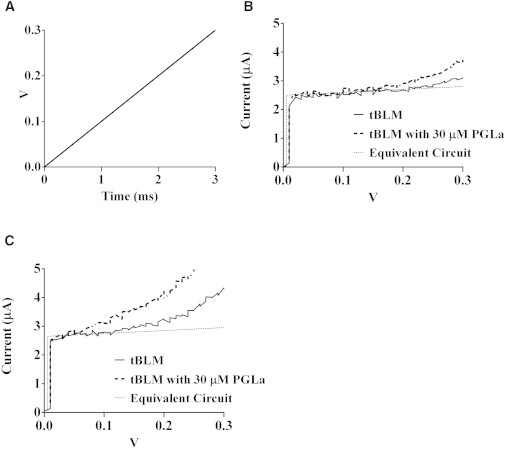
In this work, we present experimental data, supported by a quantitative model, on the generation and effect of potential gradients across a tethered bilayer lipid membrane (tBLM) with, to the best of our knowledge, novel architecture. A challenge to generating potential gradients across tBLMs arises from the tethering coordination chemistry requiring an inert metal such as gold, resulting in any externally applied voltage source being capacitively coupled to the tBLM. This in turn causes any potential across the tBLM assembly to decay to zero in milliseconds to seconds, depending on the level of membrane conductance. Transient voltages applied to tBLMs by pulsed or ramped direct-current amperometry can, however, provide current-voltage (I/V) data that may be used to measure the voltage dependency of the membrane conductance. We show that potential gradients >~150 mV induce membrane defects that permit the insertion of pore-forming peptides. Further, we report here the novel (to our knowledge) use of real-time modeling of conventional low-voltage alternating-current impedance spectroscopy to identify whether the conduction arising from the insertion of a polypeptide is uniform or heterogeneous on scales of nanometers to micrometers across the membrane. The utility of this tBLM architecture and these techniques is demonstrated by characterizing the resulting conduction properties of the antimicrobial peptide PGLa.


Figures

Figure 1
Figure 1
(A) Schematic diagram of a typical tBLM used in these experiments. (B) The equivalent circuit for the tBLM used here. For the electrode area of 2.1 mm2, the actual values have been rounded to 1500 nF, 150 nF, and 15 nF to emphasize the 10-fold differences between the capacitances at each layer of the equivalent circuit. (C) Of the 500 mV step applied across the whole circuit, ∼1%, or 0.004504 V, is initially expressed across the gold counterelectrode, Cc, ∼10%, or 0.04504 V, across the tethering gold surface, Cth, and ∼90%, or 0.4504 V, across the tethered membrane, Cm. The current response (bottom plot) initially shows a capacitive spike due to charging of Cm, Cth, and Cc. After this initial spike, the current slowly decays due to the charge being redistributed across Cth and Cc. When Cth and Cc are fully charged, the voltage across the membrane and the current will have decayed to zero. To see this figure in color, go online.
Figure 2
Figure 2
The equivalent circuit used for modeling the GOF values from impedance spectroscopy data. V2 is a measure of the potential applied across the total network impedance, and V1 is the resultant potential across the unknown load impedance. ADC, analog-to-digital converter.
Figure 3
Figure 3
(A) AC impedance spectroscopy conductance readings in response to varying concentrations of PGLa in zwitterionic lipids over time. All readings were baseline-conductance offset from the time point of addition of a 10 μL PGLa sample or a blank PBS control. (B) Peak conductance readings from A for each PGLa concentration. (C) AC impedance spectroscopy conductance readings of 30 μM PGLa added to tBLMs containing various amounts of negatively charged POPG lipids. PGLa responses are compared to the addition of 3 μM α-hemolysin to a POPG-free tBLM. (D) AC impedance GOF calculations in response to PGLa and α-hemolysin over time.
Figure 4
Figure 4
Increased capacitance caused by incorporating the anionic POPG into the lipid bilayer.
Figure 5
Figure 5
(A) Voltage-clamp data measured from a tethered lipid bilayer containing 40% negatively charged POPG lipids in the absence (upper) and presence (middle) of 30 μM PGLa peptide. For the lower plot, 50 mV voltage steps were applied for 20 ms. Recordings at each voltage step are the average of 16 sweeps. Green lines indicate time periods of 0.3 ms post pulse initiation. (B) I/V plot of responses recorded 0.3 ms post pulse initiation for control (dashed line) and in response to 30 μM PGLa (solid line). At voltages >∼150 mV, the current traces become nonlinear, suggesting an increased current due to electroporation. This is clearly evident in the PGLa case, indicating that electroporation assists with peptide insertion. (C) By integrating the data from the pulsed traces in A it is possible to calculate the charge across the membrane, and thereby the voltage across the membrane. The plot in C represents the normalized-to-peak voltage decay across the membrane to an applied 20 ms pulse of 300 mV compared to a 50 mV pulse of the same duration. Because of electroporation, a more rapid decay in voltage across the membrane is seen due to decreased resistance across the tBLM than at lower voltages. To see this figure in color, go online.
Figure 6
Figure 6
(A) Ramped voltage pattern applied to the tBLM to measure the electroporation threshold. (B) The resultant current in response to the voltage ramp illustrates the electroporation threshold, as well as the insertion of PGLa compared with the experimental current and a 5SPICE simulation of the equivalent circuit of a sealed tBLM. The initial rise in current seen in both the experimental and simulated traces confirms the capacitance readings obtained using AC impedance spectroscopy of Cm = 1.19 μF cm−2. (C) A further tBLM after exposure to three sequences of 20 ms pulses from 0 to ±500 mV in ±50 mV increments, subsequently read using the same ramped potential as in B. It should be noted that the signal/noise ratio of the currents measured arising from the ramped potentials in Fig 6, B and C, is ∼1–2 orders of magnitude lower than that from the swept-frequency AC measures.

References

    1. Heinrich F., Ng T., Lösche M. A new lipid anchor for sparsely tethered bilayer lipid membranes. Langmuir. 2009;25:4219–4229. - PubMed
    1. Cornell B.A. Memembrane-based biosensors. In: Ligler F., Taitt C.A.R., editors. Optical Biosensors: Present and Future. Elsevier Science; Amsterdam: 2002. pp. 457–459.
    1. Cornell B.A., Braach-Maksvytis V.L.B., Pace R.J. A biosensor that uses ion-channel switches. Nature. 1997;387:580–583. - PubMed
    1. Krishna G., Schulte J., Osman P.D. Tethered bilayer membranes containing ionic reservoirs: selectivity and conductance. Langmuir. 2003;19:2294–2305.
    1. Krishna G., Schulte J., Osman P.D. Tethered bilayer membranes containing ionic reservoirs: the interfacial capacitance. Langmuir. 2001;17:4858–4866.

Publication types