Review
. 2014 Feb 1;88(2):254-62.
doi: 10.1016/j.ijrobp.2013.07.022.

The tumor radiobiology of SRS and SBRT: are more than the 5 Rs involved?

Affiliations
Review

The tumor radiobiology of SRS and SBRT: are more than the 5 Rs involved?

J Martin Brown et al. Int J Radiat Oncol Biol Phys. .

Abstract

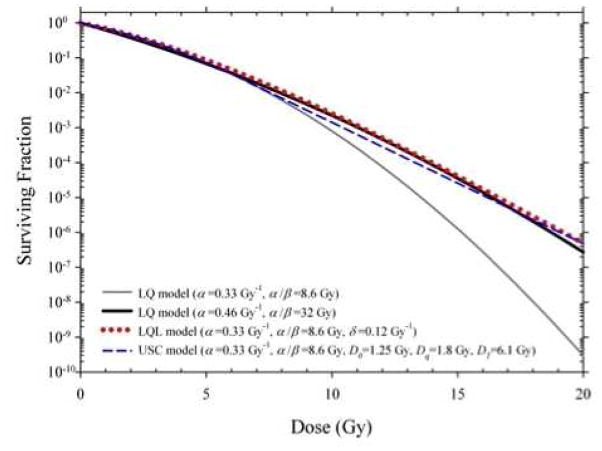
Stereotactic radiosurgery (SRS) and stereotactic body radiation therapy (SBRT), also known as stereotactic ablative radiation therapy (SABR), are rapidly becoming accepted practice for the radiation therapy of certain tumors. Typically, SRS and SBRT involve the delivery of 1 or a few large-dose fractions of 8 to 30 Gy per fraction: a major paradigm shift from radiation therapy practice over the past 90 years, when, with relatively large amounts of normal tissues receiving high doses, the goal was to maximize tumor response for an acceptable level of normal tissue injury. The development of SRS and SBRT have come about because of technologic advances in image guidance and treatment delivery techniques that enable the delivery of large doses to tumors with reduced margins and high gradients outside the target, thereby minimizing doses to surrounding normal tissues. Because the results obtained with SRS and SBRT have been impressive, they have raised the question whether classic radiobiological modeling, and the linear-quadratic (LQ) model, are appropriate for large doses per fraction. In addition to objections to the LQ model, the possibility of additional biological effects resulting from endothelial cell damage, enhanced tumor immunity, or both have been raised to account for the success of SRS and SBRT. In this review, we conclude that the available preclinical and clinical data do not support a need to change the LQ model or to invoke phenomena over and above the classic 5 Rs of radiobiology and radiation therapy, with the likely exception that for some tumors high doses of irradiation may produce enhanced antitumor immunity. Thus, we suggest that for most tumors, the standard radiobiology concepts of the 5 Rs are sufficient to explain the clinical data, and the excellent results obtained from clinical studies are the result of the much larger biologically effective doses that are delivered with SRS and SBRT.


Conflict of interest statement

Conflict of interest: none

Figures

Figure 1
Figure 1. The perceived overprediction of cell killing at high doses by the LQ model is resolved by assuming a higher α/β value
Comparison of predictions of the Linear-Quadratic (LQ), Linear-Quadratic-Linear (LQL) (14, 22), and Universal Survival Curve (USC) (17) models. LQL and USC model predictions are similar assuming an α/β of 8.6 Gy..
Figure 2
Figure 2. Isoeffect data for response in normal tissues fit the LQ model
Data for different regions (□,○,△) of the rat spinal cord (24), for acute skin reactions (◆) in mice (25), and for early (●) and late (⊕) murine intestinal damage (26). The LQ model predicts straight lines for these plots. From (15) with permission.
Figure 3
Figure 3. Tumor response is affected by the genetics of the host;
A. Response of the MCA/129 fibrosarcoma to 15 Gy either in wild-type (asmase +/+) (endothelial apoptosis sensitive) or asmase−/− (apoptosis resistant) mice. B. Response of the MCA/129 fibrosarcoma in asmase +/+ mice that had been bone marrow transplanted with bone marrow from asmase +/+ or asmase −/− mice. These data suggest that it may be the asmase −/− bone marrow, rather than the asmase −/− tumor endothelium, that confers tumor radioresistance. Adapted from (29) with permission.
Figure 4
Figure 4. An illustration of how indirect death due to vascular damage could contribute to total clonogenic cell kill in tumors irradiated with large single doses of radiation
The model assumes 10% of the tumor cells are maximally radioresistant hypoxic cells. The dotted lines indicate the response of oxic (- - - - -) and hypoxic (– – – –) tumor cells. The response at doses 0–5 Gy is dominated by oxic cells (a), while that at 5–12 Gy is dominated by hypoxic cells (b). As radiation dose is increased above 12 Gy, it is suggested that indirect cell death due to vascular damage (c) can enhance total cell kill. From (60) with permission
Figure 5
Figure 5. Conflicting data on whether large single doses produce indirect cell kill
A: Data on the Walker 256 tumor showing falling cell survival following a single dose of 10 Gy (originally published in 1978 and reproduced recently (60) with permission) B (upper) Gross response of the rat rhabdomyosarcoma to 10 or 20 Gy (lower): Data on the cell survival from the same tumors as a function of time after irradiation. Note there is no evidence for a fall in cell survival over the first 4 days after irradiation, prior to the rapid growth of the surviving cells From (38) with permission.
Figure 6
Figure 6. The radiation dose to control 50% of the tumors (TCD50) is well predicted from the radiosensitivity of the cells in vitro and the number of cells needed to transplant the tumor (TD50)
The observed TCD50 under air breathing conditions as a function of the predicted TCD50s, calculated from tumor cell radiosensitivity (in the 0–12 Gy range) and tumor clonogen number (from the TD50). Error bars are 1 SD. From (48) with permission.
Figure 7
Figure 7. Modeling (using the 5 R’s) predicts loss of efficacy of tumor cell kill for the same level of normal tissue toxicity as the dose/fraction increases
Predicted surviving fraction of tumor cells for different size dose fractionations assuming full reoxygenation between fractions, Dependence of predictions on the assumed hypoxic fraction of the tumor, fhyp, is shown. It is evident that there is less cell kill predicted for very few fractions compared to standard fractionation for the same BED (response of well-oxygenated normal tissues). From (11) with permission.
Figure 8
Figure 8. Tumor control probability (TCP) as a function of biologically effective dose (BED) for stage I NSCLC
Left panel: Symbols show local control rates (≥2 years) from a pooled analysis reported by Mehta et al. (27) with symbols distinguishing conventional and SBRT fractionations. Right panel: Weighted mean TCP probabilities calculated to compensate for the different numbers of patients in each study. Solid lines show LQ-based fits to the data which show that, within the limits of clinical data, the efficacy of single doses, a few SBRT fractions, and conventional radiotherapy produce the same overall TCP for the same BED. From (58) with permission.

Comment in

Similar articles

Cited by

References

    1. Withers HR. The four R’s of radiotherapy. In: Lett JTAH, editor. Advances in radiation biology. Vol. 5. New York: Academic Press; 1975. pp. 241–271.
    1. Steel GG, McMillan TJ, Peacock JH. The 5Rs of radiobiology. Int J Radiat Biol. 1989;56:1045–1048. - PubMed
    1. Puck TT, Markus PI. Action of x-rays on mammalian cells. J Exper Med. 1956;103:653–666. - PMC - PubMed
    1. Sachs RK, Hahnfeld P, Brenner DJ. The link between low-LET dose-response relations and the underlying kinetics of damage production/repair/misrepair. International journal of radiation biology. 1997;72:351–374. - PubMed
    1. Carlson DJ, Stewart RD, Semenenko VA, et al. Combined use of Monte Carlo DNA damage simulations and deterministic repair models to examine putative mechanisms of cell killing. Radiat Res. 2008;169:447–459. - PubMed

MeSH terms