. 2014 Jan 8;81(1):77-90.
doi: 10.1016/j.neuron.2013.10.052.

Histidine decarboxylase deficiency causes tourette syndrome: parallel findings in humans and mice

Affiliations

Histidine decarboxylase deficiency causes tourette syndrome: parallel findings in humans and mice

Lissandra Castellan Baldan et al. Neuron. .

Erratum in

  • Neuron. 2014 Jun 4;82(5):1186-7

Abstract

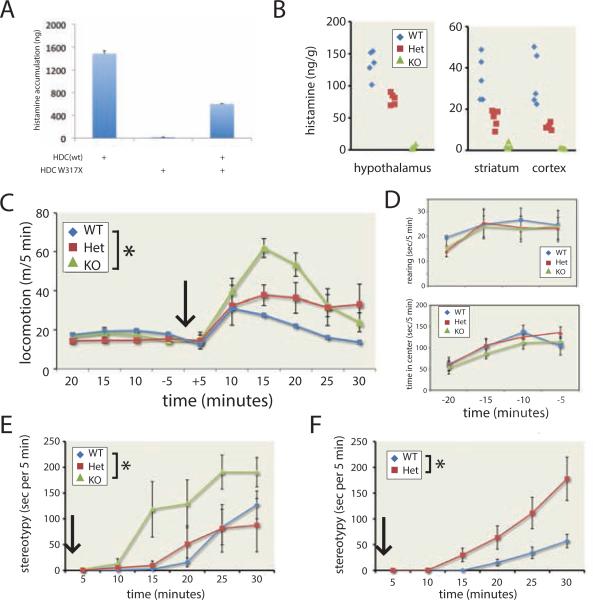
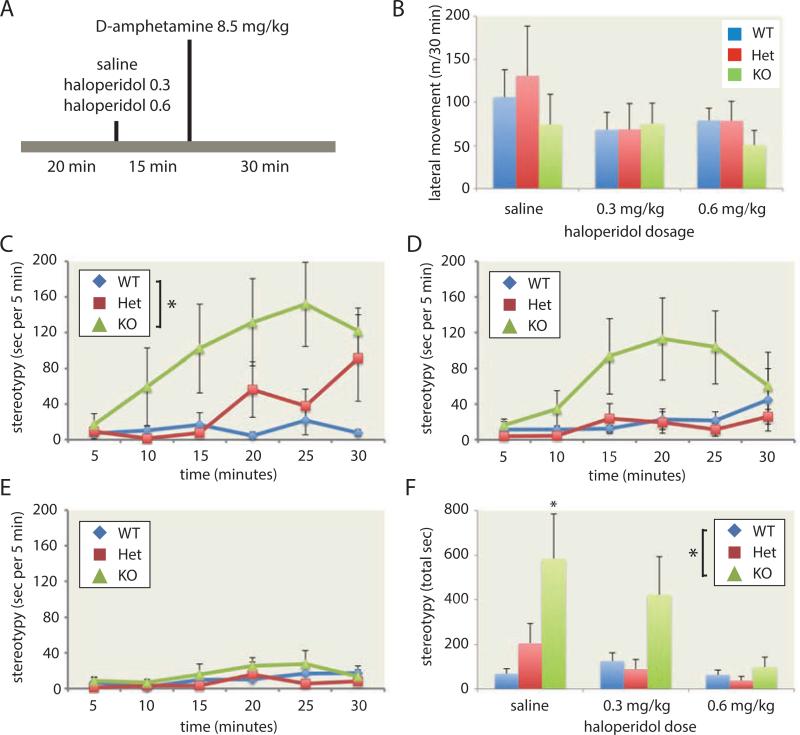
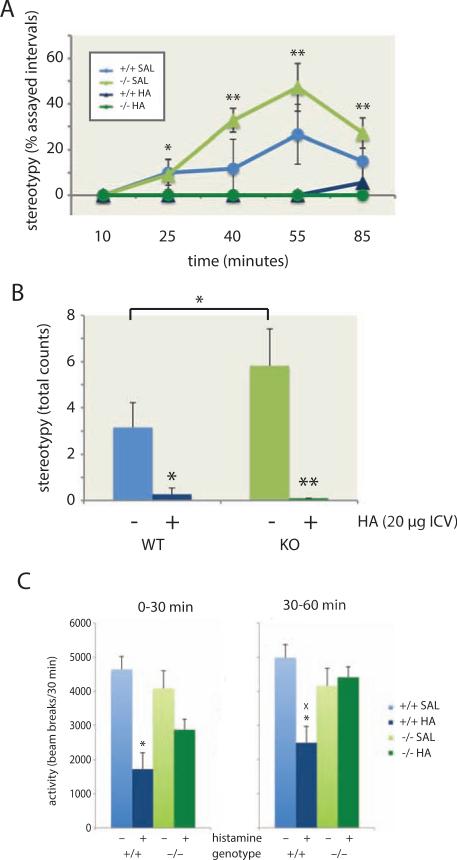
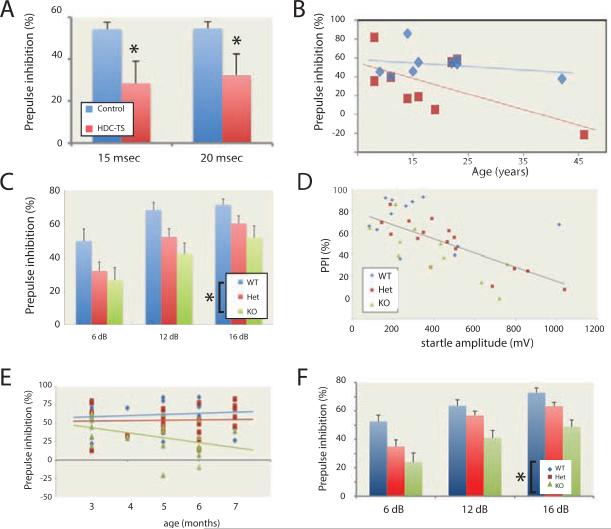
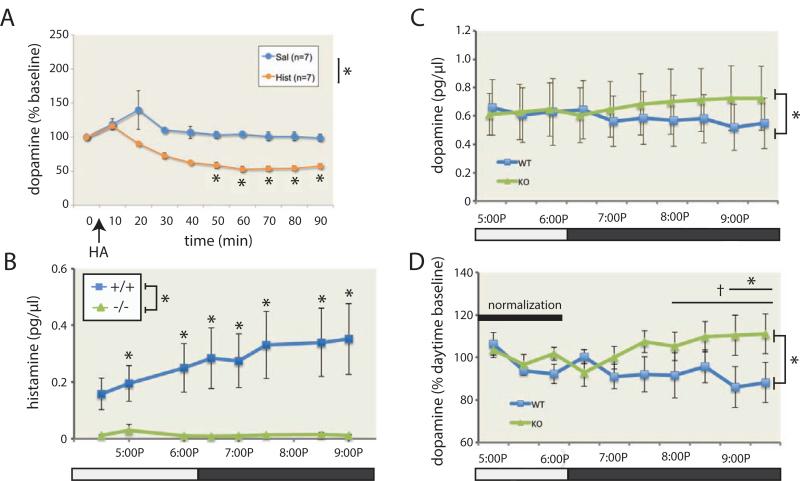
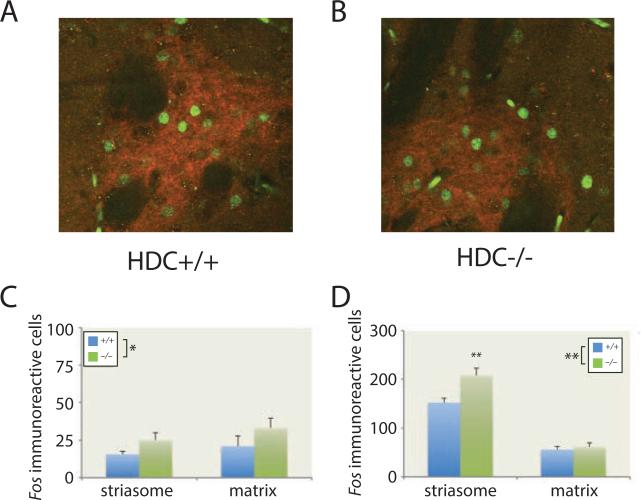
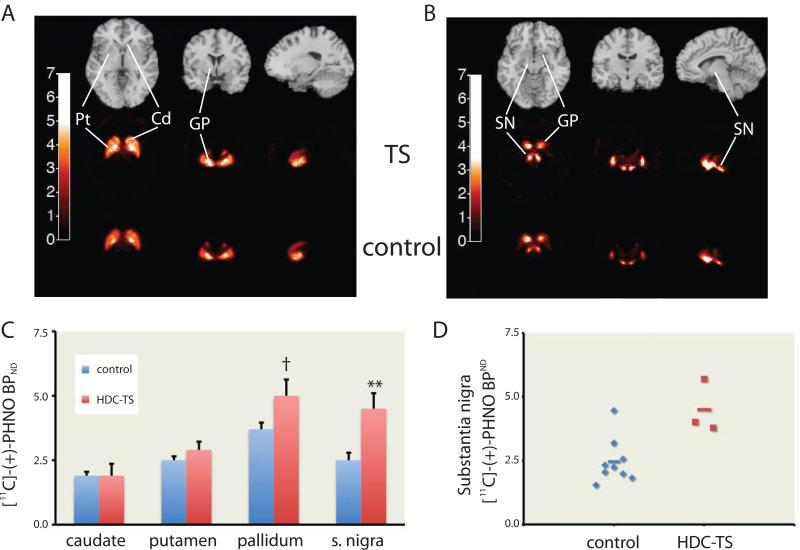
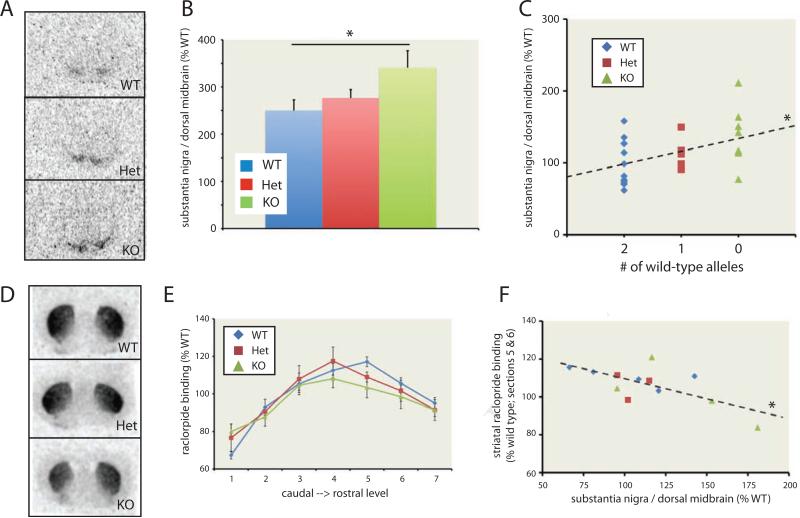
Tourette syndrome (TS) is characterized by tics, sensorimotor gating deficiencies, and abnormalities of cortico-basal ganglia circuits. A mutation in histidine decarboxylase (Hdc), the key enzyme for the biosynthesis of histamine (HA), has been implicated as a rare genetic cause. Hdc knockout mice exhibited potentiated tic-like stereotypies, recapitulating core phenomenology of TS; these were mitigated by the dopamine (DA) D2 antagonist haloperidol, a proven pharmacotherapy, and by HA infusion into the brain. Prepulse inhibition was impaired in both mice and humans carrying Hdc mutations. HA infusion reduced striatal DA levels; in Hdc knockout mice, striatal DA was increased and the DA-regulated immediate early gene Fos was upregulated. DA D2/D3 receptor binding was altered both in mice and in humans carrying the Hdc mutation. These data confirm histidine decarboxylase deficiency as a rare cause of TS and identify HA-DA interactions in the basal ganglia as an important locus of pathology.


Figures

Figure 1
Figure 1. Reduced HA levels and stereotypy in Hdc knockout and haploinsufficient mice
A. Hdc W317X was devoid of enzymatic activity; addition of equimolar Hdc W317X to a constant amount of wild-type Hdc mRNA reduced histamine accumulation, confirming the in vitro dominant-negative effect of this mutant. B. Hdc +/− and −/− mice showed reduced whole-tissue histamine in hypothalamus (left), striatum, and neocortex (right), confirming efficacy of the knockout and haploinsufficiency in +/− mice (n = 5 per genotype). C. All genotypes showed similar exploratory activity over 20 minutes in a novel open field. Following 8.5 mg/kg D-amphetamine (IP, in normal saline), WT mice showed locomotor activation, which was attenuated in −/− and +/− mice (RM-ANOVA, genotype, F[2,15] = 3.8, p = 0.04; time × genotype, F[10,75] = 2.15, p = 0.02; n = 6 per genotype). D. Prior to amphetamine, KO mice showed normal rearing (upper panel) and center occupancy time (lower panel) in the open field, confirming normal exploratory activity and anxiety. E. KO mice showed markedly increased stereotypy, beginning 10 minutes after D-amphetamine injection. RM-ANOVA, genotype: F[2,15] = 3.8; p = 0.04; time × genotype, F[10,75] = 1.83, p = 0.06. F. At a higher dose of D-amphetamine (10 mg/kg), several −/− mice became completely immobile, making quantification of stereotypy impossible; +/− mice, however, now showed enhanced stereotypy (RM-ANOVA, genotype: F[1,10] = 7.70, p = 0.01; time × genotype: F[5,50] = 4.36, p = 0.002; n = 6 per group). * p < 0.05. See also Figure S1.
Figure 2
Figure 2. Attenuation of tic-like stereotypies in Hdc +/− and −/− mice after pretreatment with haloperidol
A. Experimental design. B. Haloperidol pretreatment produced a modest reduction in amphetamine-induced locomotion (F[2,22] = 6.86, p = 0.005) that did not vary by genotype (main effect of genotype: F[2,11] = 0.27, p > 0.75; genotype × dose interaction: F[4,22] = 0.36, p > 0.8; n = 5 mice per group). C. Tic-like stereotypy was again seen in Hdc +/− and −/− mice after saline pretreatment (n = 5 mice per group; RM-ANOVA with genotype and treatment order as independent factors: main effect of genotype, F[2, 10] = 5.7, p = 0.022; main effect of time, F[5,50] = 5.7, p < 0.001; genotype × time interaction, F[10,50] = 2.4, p = 0.019). D. Pretreatment with 0.3 mg/kg haloperidol attenuated the development of stereotypies. E. Pretreatment with 0.6 mg/kg haloperidol eliminated stereotypies in all genotypes (RM-ANOVA across all haloperidol doses: main effect of time, F[5,45] = 6.67, p < 0.001; main effect of haloperidol dose, F[2,18] = 4.42, p = 0.027; main effect of genotype, F[2,9] = 4.4, p = 0.046; genotype × time, F[10,45] = 2.10, p = 0.044). F. Total stereotypies across the 30 minutes following amphetamine treatment are shown for each condition (RM-ANOVA: Main effect of genotype, F[2,9] = 4.39, p = 0.046; main effect of haloperidol treatment, F[2,18] = 4,42, p = 0.027). * p < 0.05 vs. wild-type, main effect or Bonferroni-corrected post-hoc. n = 5 animals per genotype; see main text for detailed statistical analysis. See also Figure S2.
Figure 3
Figure 3. Mitigation of stereotypies by histamine repletion
A,B. Increased stereotypies were again seen after D-amphetamine, and were potentiated in Hdc −/− animals, in after ICV saline. These stereotypies were completely eliminated after HA infusion (20 μg). Saline groups: RM-ANOVA of genotype and treatment order, main effect of genotype, F[1,19] = 3.22, p = 0.09, significant at alpha = 0.1 for a predicted directional effect; main effect of time, F[4,76] = 9.26, p<0.001; n = 12 mice of each genotype. See main text for analysis of HA effects. C. HA infusion led to reduced locomotor activation following amphetamine; however, this effect dissociated from the mitigation of stereotypies, as locomotor activity recovered in the second 30 minutes following amphetamine injection in Hdc −/− animals. * p < 0.05; ** p < 0.01; x p < 0.05 genotype effect. See also Figure S3.
Figure 4
Figure 4. Impaired prepulse inhibition in humans and mice with deficient HDC activity
A. Patients carrying the Hdc W317X mutation showed impaired PPI, measured 15 and 20 msec after the startle stimulus. N = 9 Hdc W317X carriers, 9 matched controls. 1-tailed heteroskedastic t-test: 15 msec, t = 2.14, p = 0.02; 20 msec, t = 1.81, p = 0.04. B. There was a weak negative association between PPI and age among the patients, but it did not reach statistical significance (data are shown for the 20 msec timepoint; p = 0.08; p = 0.16 at 15 msec). The association of PPI with age did not approach significance in controls. The effect of genotype on PPI remained significant after covarying for age (20 msec: 20 msec: main effect of genotype, F[1,15] = 4.45, p = 0.05; 15 msec: main effect of genotype, F[1,15] = 5.89, p = 0.03). C. Hdc +/− and −/− mice showed a deficit in tone PPI at three prepulse intensities. RM-ANOVA: F[2,31] = 4.50; p = 0.019; n = 12 +/+, 16 +/−, 11 −/−. D. Hdc +/− and −/− mice showed enhanced startle, but the PPI phenotype was not explained by this increased startle. r = −0.643; p < 0.001; data shown are for the first PPI block; a similar effect was seen in the second block: r = −0.622, p < 0.001. When analyzed separately, this correlation was seen in heterozygotes (n = 16; r = −0.842; p < 0.001) and knockouts (n = 11; r = 0.780; p = 0.005) but not in WT mice (n = 12; r = −0.244; p > 0.4). RM-ANCOVA: F[2,35] = 6.67; p = 0.004; main effect of prepulse intensity: F[1,35] = 65.1, p < 0.001. E. In a larger group of mice tested at different ages, the PPI phenotype did not change with age. RM-ANCOVA: main effect of genotype, F[2,56] = 3.79, p = 0.03; age, F[1,56] = 0.12, p > 0.7; n = 16 +/+, 23 +/−, 23 −/−. F. This PPI phenotype was replicated when animals were tested in their dark phase. RM-ANOVA across the three prepulse intensities: F[2,72] = 8.0, p = 0.001; n = 21 +/+, 26 +/−, 28 −/−. All data represented as mean ± SEM. * p < 0.05. See also Figure S4
Figure 5
Figure 5. Histamine regulates striatal dopamine
A. HA (20 μg) or saline was infused ICV into wild-type mice, as in Figure 3. DA in microdialysate from the contralateral striatum was markedly reduced, starting 20 min after HA administration. n = 7 HA, 7 saline; RM-ANOVA: main effect of time, F[9,108] = 10.5, p < 0.001; main effect of HA, F[1,12] = 28.6, p < 0.001; time × HA, F[9,108] = 3.9, p < 0.001. B. HA in striatal microdialysate was dramatically reduced in Hdc −/− mice relative to controls. RM-ANOVA: main effect of genotype, F[1,14] = 6.60, p = 0.02; genotype × time, F[7,98] = 4.23, p < 0.001; n = 8 animals per group. C. Dopamine in striatal microdialysate showed a significant genotype by time interaction: F[9,126] = 2.70, p = 0.007; n = 8 animals per group. D. Microdialysis data were normalized to the daytime baseline to reduce between-animal technical variability. The interaction was again apparent (main effect of genotype, F[1,14] = 2.99, p = 0.11; genotype × time, F[9.126] = 2.85, p = 0.004); the genotype difference reached trend level across the final 4 timepoints (RM-ANOVA, F[1,14] = 3.8, p = 0.07) and significance across the final 2 (F[1,14] = 4.6, p = 0.05). † p < 0.1; * p < 0.05. All data represented as mean ± SEM. See also Figure S5.
Figure 6
Figure 6. Elevated striatal Fos expression in Hdc −/− mice is potentiated in striasomes by amphetamine
A,B. Fos-positive cells (green) and μ-opioid immunoreactivity (red), a marker of striasomes (patches), 45 minutes after 5 mg/kg D-amphetamine in a Hdc +/+ mouse (A) and a Hdc −/− mouse (B). C. At baseline there was modestly but signifcantly increased Fos in Hdc −/− mice. RM-ANOVA, main effect of genotype, F[1,10] = 49.8, p < 0.001; effect of compartment and interaction NS; n = 6 slices from each of 6 mice per genotype. D. After D-amphetamine there was increased Fos expression in both compartments (note y-axis scale), but much more prominently in striasomes; striasomal activation was specifically potentiated in Hdc −/− mice. RM-ANOVA: main effect of genotype, F[1,10] = 8.7, p = 0.015; main effect of compartment, F[1,10] = 207, p < 0.0001; interaction, F[1,10] = 6.29, p = 0.03; n = 2 slices from each of 6 animals. Post-hoc genotype effects: * p < 0.05; ** p < 0.01.
Figure 7
Figure 7. Elevated substantia nigra D2/D3 binding in Hdc W317X patients and HDC-KO mice
A. [11C]-PHNO binding potential (BPND) in the striatum and globus pallidus (GP). Top row – structural MRI images for anatomical reference; second row – PHNO binding in TS patients carrying the Hdc W317X allele; bottom row – PHNO binding in matched control subjects (see Supplementary Table 2). B. [11C]-PHNO binding in more inferior, posterior, and medial sections, showing the GP and substantia nigra (SN). C. Patients carrying the Hdc W317X allele showed normal [11C]-PHNO binding in caudate and putamen, but elevated binding in GP and SN. RM-ANOVA: main effect of group: F[1,10] = 7.54; p = 0.035; main effect of region: F[3,30] = 33.48, p < 0.001; group × region interaction, F[3,30] = 6.85, p = 0.001. n = 3 Hdc W317X patients, 9 controls (see Table S2). D. Separation between patients and controls was particularly striking in SN. Mann-Whitney U test: p = 0.03. † uncorrected p < 0.05; ** uncorrected p < 0.01, significant after Bonferroni correction. See also Figure S6.
Figure 8
Figure 8
A. Ex vivo raclopride binding in SN of Hdc +/+, +/−, and −/− mice. B. Normalized SN binding was elevated in Hdc +/− and −/− mice relative to +/+ controls. C. Binding correlated with the # of knockout alleles (r = 0.445; β = 31.795; p = 0.02). D. Stronger raclopride binding was seen in striatum, reflecting the high density of D2 receptors there. E. Regression analysis across genotypes and caudal-rostral location showed a small but significant inverse relationship between dorsal striatal raclopride binding and # of HDC knockout alleles, suggesting D2 downregulation in the dorsal striatum in HDC knockout mice (β = −3.613, p = 0.017 for alleles; β = 6.01, p < 0.001 for R-C level). F. Raclopride binding in the mid-striatum (A-P levels 5-6), where the effect of genotype on binding was most pronounced, was negatively correlated with nigral raclopride binding in the same animals: r = −0.682; p = 0.015. All data represented as individual data points or as mean ± SEM. * p < 0.05. n = 5 Hdc +/+ (12 SN slices, 23 str slices), 4 Hdc +/− (8 SN slices, 15 str slices), 6 Hdc −/− (8 SN slices from 4 mice; 21 str slices). See also Figure S6.

References

    1. Acevedo SF, Ohtsu H, Benice TS, Rizk-Jackson A, Raber J. Age-dependent measures of anxiety and cognition in male histidine decarboxylase knockout (Hdc−/−) mice. Brain Res. 2006;1071:113–123. - PubMed
    1. Ahmari SE, Risbrough VB, Geyer MA, Simpson HB. Impaired sensorimotor gating in unmedicated adults with obsessive-compulsive disorder. Neuropsychopharmacology. 2012;37:1216–1223. - PMC - PubMed
    1. Albin RL. Neurobiology of basal ganglia and Tourette syndrome: striatal and dopamine function. Advances in neurology. 2006;99:99–106. - PubMed
    1. Albin RL, Young AB, Penney JB. The functional anatomy of basal ganglia disorders. Trends in neurosciences. 1989;12:366–375. - PubMed
    1. Alexander GE, DeLong MR, Strick PL. Parallel organization of functionally segregated circuits linking basal ganglia and cortex. Annual review of neuroscience. 1986;9:357–381. - PubMed

Publication types

MeSH terms