. 2014 Jan 8;81(1):153-64.
doi: 10.1016/j.neuron.2013.10.041.

Dopamine D2 receptors regulate the anatomical and functional balance of basal ganglia circuitry

Affiliations

Dopamine D2 receptors regulate the anatomical and functional balance of basal ganglia circuitry

Maxime Cazorla et al. Neuron. .

Abstract

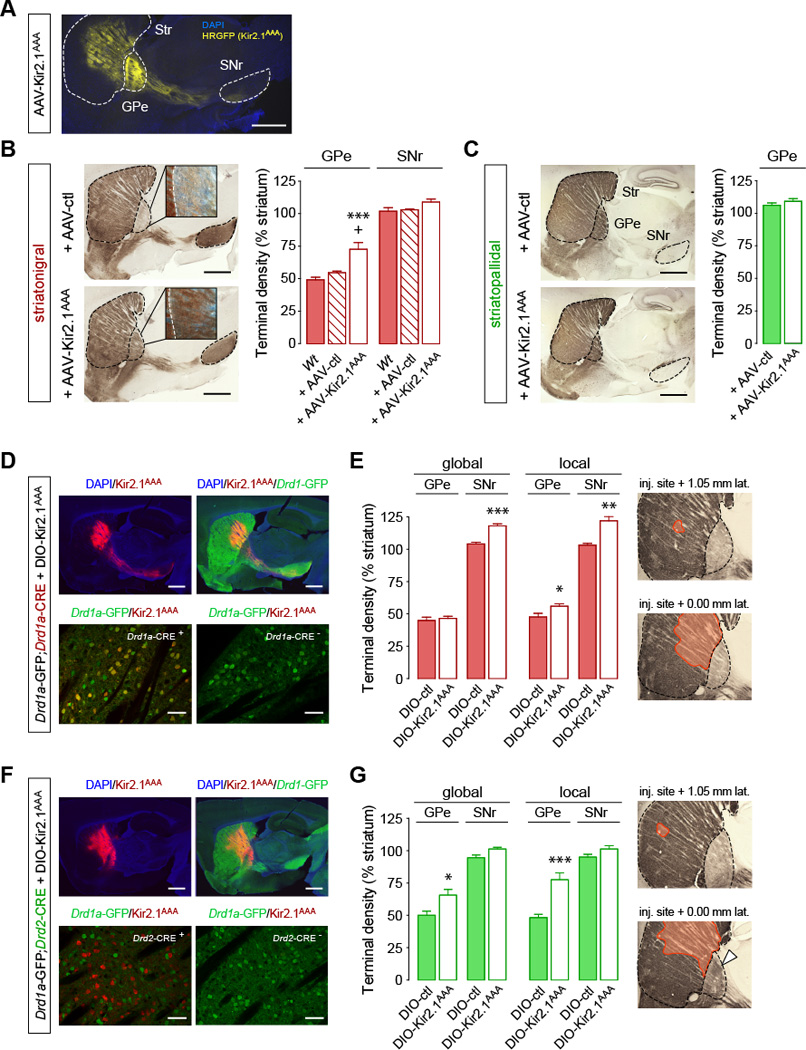
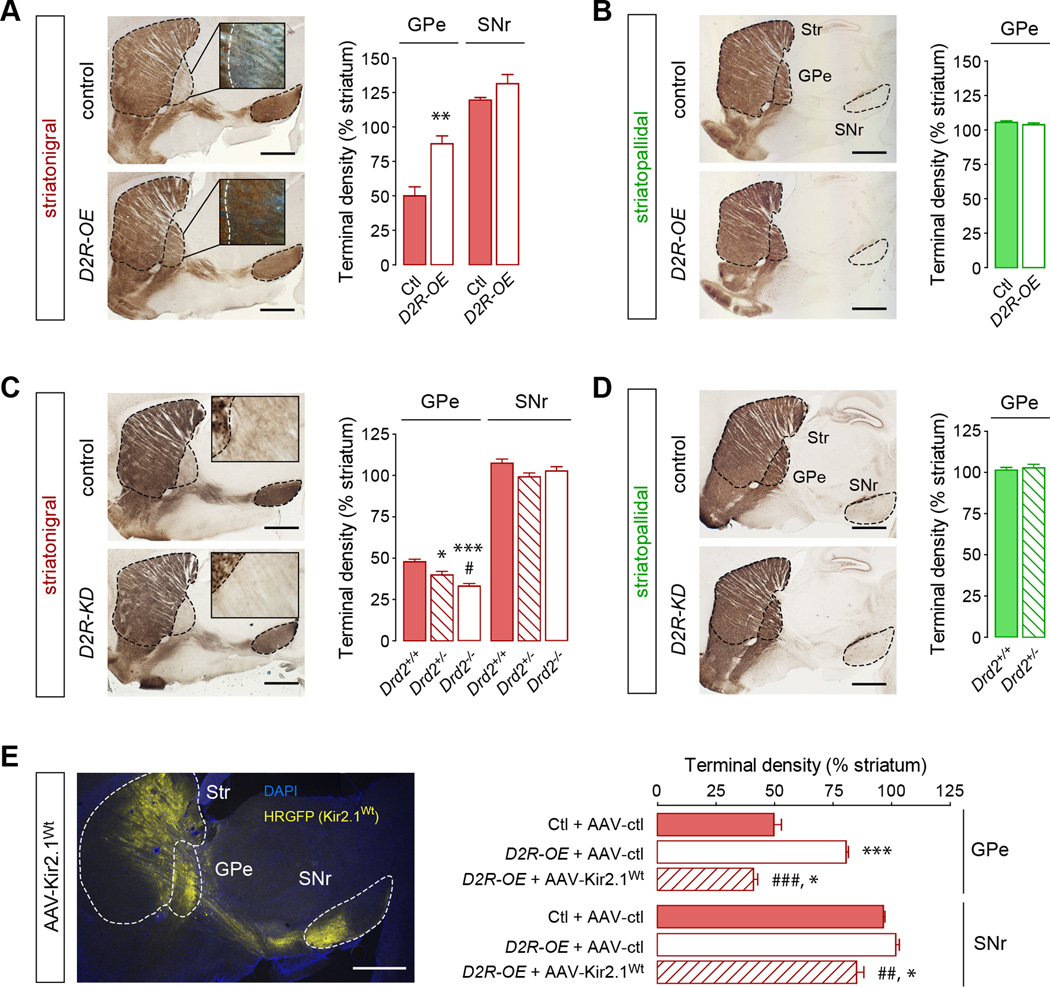
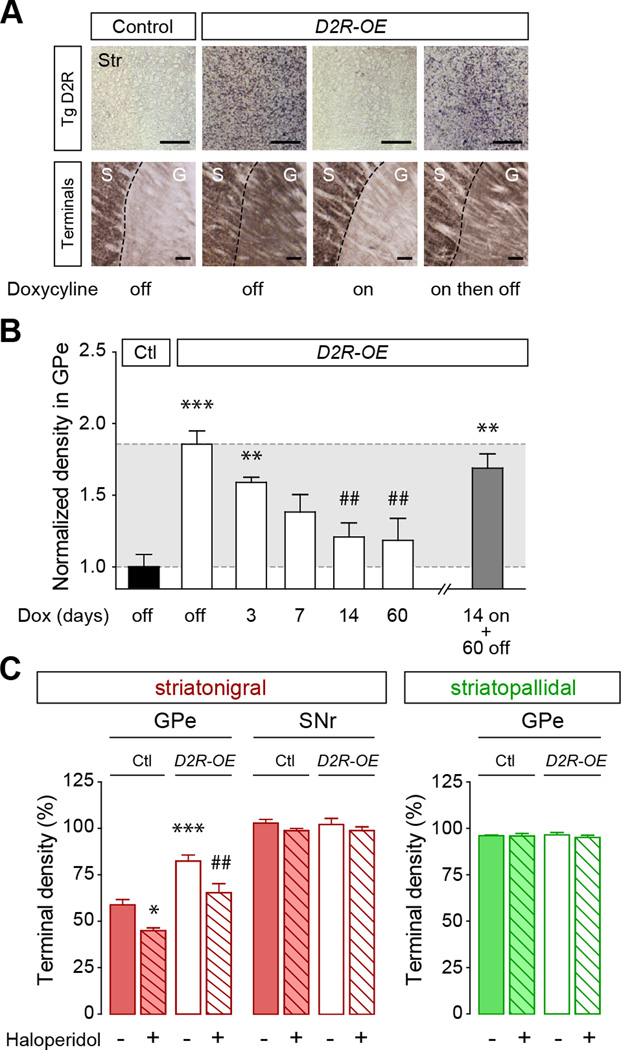
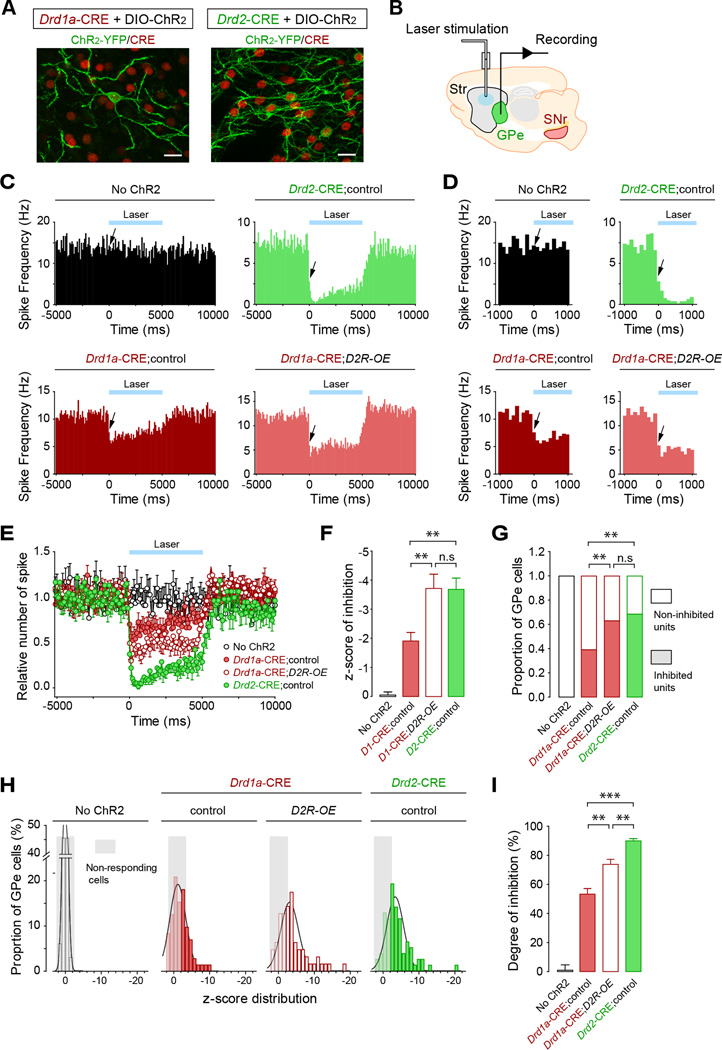
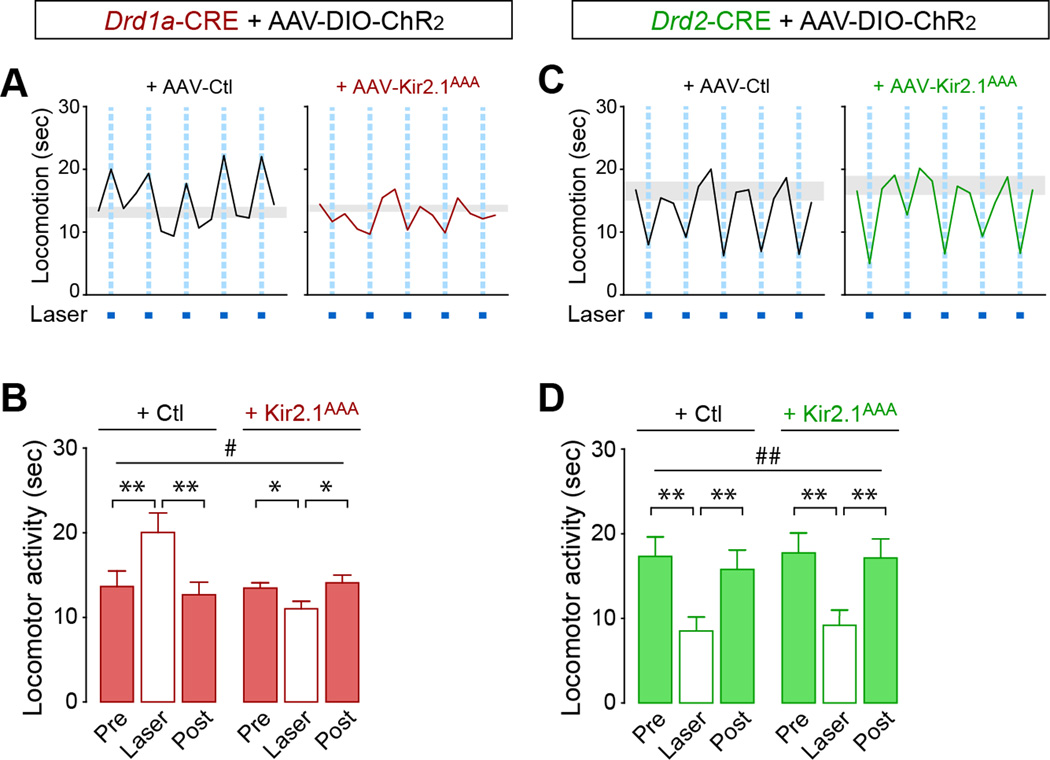
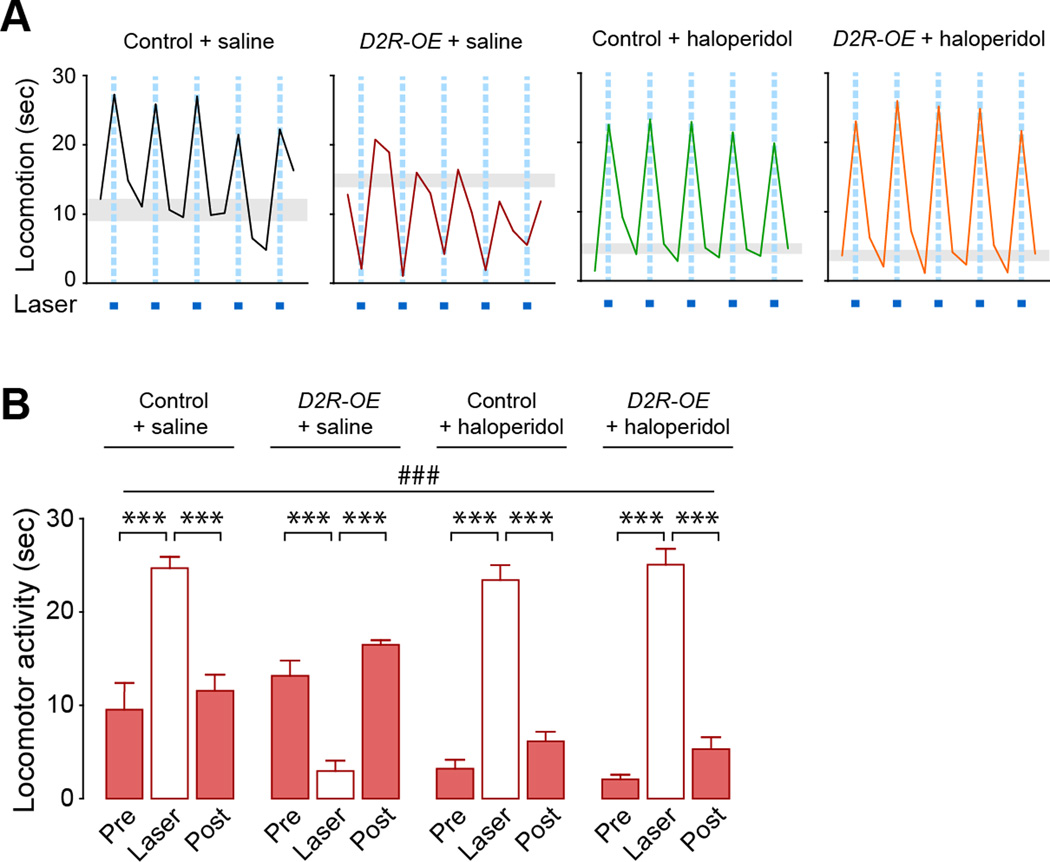
Structural plasticity in the adult brain is essential for adaptive behavior. We have found a remarkable anatomical plasticity in the basal ganglia of adult mice that is regulated by dopamine D2 receptors (D2Rs). By modulating neuronal excitability, striatal D2Rs bidirectionally control the density of direct pathway collaterals in the globus pallidus that bridge the direct pathway with the functionally opposing indirect pathway. An increase in bridging collaterals is associated with enhanced inhibition of pallidal neurons in vivo and disrupted locomotor activation after optogenetic stimulation of the direct pathway. Chronic blockade with haloperidol, an antipsychotic medication used to treat schizophrenia, decreases the extent of bridging collaterals and rescues the locomotor imbalance. These findings identify a role for bridging collaterals in regulating the concerted balance of striatal output and may have important implications for understanding schizophrenia, a disease involving excessive activation of striatal D2Rs that is treated with D2R blockers.


Figures

Figure 1
Figure 1. Excitability of the indirect pathway regulates the local growth of direct pathway collaterals into the adult GPe
(A–C) Increasing MSN excitability promotes the growth of striatonigral terminal fields in the GPe of adult mice. (A) Sagittal sections showing Kir2.1AAA-ires-HRGFP expression in the striatum. Scale bar, 1 mm. (B,C) Quantification of striatonigral (B) and striatopallidal (C) terminal fields density in adult mice expressing the dominant negative Kir2.1AAA. ***p<0.001, compared to Wt; +p<0.05, compared to Wt + AAV-ctl; Data are presented as mean ± SEM (n=4–6 mice/group). Scale bar, 1 mm. Insets, 40x magnification (darkfield). (D–G) Excitability of striatopallidal pathway is sufficient to induce the growth of striatonigral bridging collaterals into the GPe. (D,F) Sagittal sections showing expression of DIO-Kir2.1AAA-ires-mCherry (red) and GFP (green) in Drd1a-GFP;Drd1a-CRE (D) and in Drd1a-GFP;Drd2-CRE (F) mice. Scale bar 1 mm (up), 50 µm (bottom). (E,G) Global and local quantification of striatonigral terminal density in Drd1a-GFP;Drd1a-CRE (E) and in Drd1a-GFP;Drd1a-CRE (G) + DIO-Kir2.1AAA mice. Global effect was assessed by quantifying striatonigral terminal density throughout the whole GPe. Local effect was assessed by quantifying terminal density in GPe regions containing mCherry-labeled terminal fields. *p<0.05, **p<0.01, ***p<0.005, compared to DIO-ctl; Data are presented as mean ± SEM (n=4–5 mice/group). Insets represent the striatal area expressing Kir2.1AAA-ires-mCherry (orange). Note that the increase in bridging collaterals is mainly restricted to the vicinity of Kir2.1AAA-infected striatopallidal terminals in line with the topographical organization of the striatopallidal connections (white arrows). See also Figure S1.
Figure 2
Figure 2. D2 receptors bi-directionally control the extent of bridging collaterals by regulating MSN excitability
(A–D) GPe striatonigral bridging terminals are increased with D2R gain-of-function (D2R-OE mice) and decreased with D2R loss-of-function (Drd2−/− mice). (A,B) Sagittal sections and terminal density quantification of striatonigral (A) and striatopallidal (B) pathways in control and D2R-OE mice. (C,D) Sagittal sections and terminal density quantification of striatonigral (C) and striatopallidal (D) pathways in Drd2+/+ and Drd2−/− mice. *p<0.05, **p<0.01, ***p<0.005, compared to controls; #p<0.05, Drd2+/− vs. Drd2−/−; Data are presented as mean ± SEM (n=4–6 mice/group). (E) Increased bridging terminal density is restored in D2R-OE mice after striatal expression of AAV-Kir2.1Wt-ires-HRGFP. *p<0.05, ***p<0.005, compared to Ctl+AAV-ctl; ##p<0.01, ###p<0.005, compared to D2R-OE+AAV-ctl; Data are presented as mean ± SEM (n=4–6 mice/group). Scale bars, 1 mm. Insets, 40x magnification (A, darkfield; C, brightfield). See also Figure S2.
Figure 3
Figure 3. Bridging collaterals are highly plastic in the adult animal and are sensitive to haloperidol
(A) Transgenic D2R mRNA expression (upper row, in situ hybridization, scale bar 500 µm) is switched off in adult D2R-OE mice by doxycycline application (Dox on). Expression is reestablished after removal of doxycycline (Dox on then off). Increased striatonigral GPe collaterals (bottom row, Drd1a-GFP immunostaining, scale bar 100 µm) are reversed to normal after switching transgene expression off (Dox on). Collaterals grow back after re-expressing the transgene (Dox on then off). (B) Kinetics of collaterals retraction in the GPe of D2R-OE mice treated with doxycycline for increasing time periods and re-growth after re-expressing the transgene for 60 days (14 on + 60 off). Values are normalized to control mice and are presented as mean ± SEM (n=5–6 mice/group). (C) Reduction of striatonigral but not striatopallidal terminals in the GPe of control and D2R-OE mice treated for 14 days with haloperidol (1 mg/kg/day). *p<0.05, **p<0.01, ***p<0.005, compared to control; ##p<0.01, compared to D2R-OE; Data are presented as mean ± SEM (n=8–9 mice/group). See also Figure S3.
Figure 4
Figure 4. Increased striatonigral bridging collaterals are associated with enhanced GPe inhibition
(A,B) Set-up for the selective optogenetic activation of direct or indirect pathways and concurrent recording of GPe cells in vivo. (A) Example of CRE-positive Drd1a- and Drd2-MSNs (red) expressing ChR2-YFP (green) in the dorsomedial striatum. Scale bars, 20 µm. (B) Schematic depicting fiber-optic implantation in the dorsomedial striatum and positioning of the recording electrode in the GPe. (C–I) Optogenetic activation of the direct pathway reveals inhibition in the GPe that is enhanced in D2R-OE mice. (C) Peri-stimulus time histograms (PSTH) showing the mean spike frequency of all recorded GPe neurons before, during and after the 5-sec laser stimulation (100 ms-bins). Mice were injected with a control virus (No Chr2) or with a DIO-ChR2 virus for Drd1a-CRE;control, Drd1a-CRE;D2R-OE and Drd2-Cre mice. (D) Zoom-in of PSTH in (C) showing the latency of response 1000 ms before and after laser illumination. Arrows indicate the first 100 ms-bin recorded after laser stimulation. (E) Summary graphs of relative firing frequency showed in (C) for direct comparison of the four groups before, during and after the 5-sec laser illumination. (F) Change in firing rate during laser-induced stimulation of direct or indirect pathway expressed as a z-score of the pre-stimulation firing rate distribution. **p<0.01; n.s, not significant. All experimental groups differ from the control “No Chr2 group” (p<0.001). (G) Proportion of GPe cell units for which basal firing rate is significantly decreased after laser stimulation. **p<0.01; n.s, not significant. All experimental groups differ from the control group (p<0.001). (H) Distribution of GPe cells response after laser-induced activation of direct or indirect pathway (1-bin z-scores). A cut-off was determined at −2 (2 negative standard deviations) to define cells that are significantly inhibited after laser stimulation. (I) Degree of inhibition of GPe cells after laser-induced activation of direct and indirect pathways. **p<0.01. All experimental groups differ from the control group (p<0.001). Data are presented as mean ± SEM (No Chr2 injected: n=3 mice (33 neurons), Drd1a-CRE;control: n=5 (72), Drd1a-CRE;D2R-OE: n=5 (63), Drd2-CRE;control: n=6 (78).
Figure 5
Figure 5. Increased bridging collaterals are associated with disrupted behavioral activation of the direct pathway
(A–D) Behavioral activation after direct pathway stimulation is disrupted in AAV-Kir2.1AAA-injected mice. (A,C) Traces show locomotor activity of Drd1a-CRE;DIO-ChR2 (A) or Drd2-CRE;DIO-ChR2 (C) + AAV-ctl or +AAV-Kir2.1AAA mice during open field performance. Note that AAV-ctl and AAV-Kir2.1AAA are CRE-independent and are expressed in both pathways. (B,D) Summary of locomotor activity during a 30-sec session measured in (A,C) respectively. #p<0.05, ###p<0.001, repeated two-way ANOVA. *p<0.05, ***p<0.001 compared to laser; Data are presented as mean ± SEM (n=5 mice/group). A significant interaction between Kir2.1AAA and laser illumination was observed in the direct pathway (B, p<0.001) but not in the indirect pathway (D). Data are mean only in A,C. Gray boxes represent s.e.m. of basal locomotion (pre+post). See also Figure S5.
Figure 6
Figure 6. Disrupted behavioral activation of the direct pathway in D2R-OE mice is rescued by haloperidol
(A,B) Laser stimulation of the direct pathway induces motor inhibition in D2R-OE mice and is rescued after chronic treatment with haloperidol. (A) Traces show laser-induced locomotor activity of Drd1a-CRE;DIO-ChR2;control and Drd1a-CRE;DIO-ChR2;D2R-OE mice treated with either saline or haloperidol (1 mg/kg/day) for 2 weeks. (B) Summary of locomotor activity during a 30-sec session measured in (A).###p<0.0001, repeated two-way ANOVA. ***p<0.0001 compared to laser; Data are presented as mean ± SEM (n=6–8 mice/group). A significant interaction between D2R manipulation (D2R-OE and/or haloperidol) and laser illumination was observed (p<0.0001). Data are mean only in A. Gray boxes represent s.e.m. of basal locomotion (pre+post). Chronic haloperidol has no effect on behavioral inhibition after indirect pathway activation (see Figure S6).

References

    1. Albin RL, Young AB, Penney JB. The functional anatomy of basal ganglia disorders. Trends Neurosci. 1989;12:366–375. - PubMed
    1. Alexander GE, DeLong MR, Strick PL. Parallel organization of functionally segregated circuits linking basal ganglia and cortex. Annual Review of Neuroscience. 1986;9:357–381. - PubMed
    1. Bach ME, Simpson EH, Kahn L, Marshall JJ, Kandel ER, Kellendonk C. Transient and selective overexpression of D2 receptors in the striatum causes persistent deficits in conditional associative learning. Proc Natl Acad Sci U S A. 2008;105:16027–16032. - PMC - PubMed
    1. Catalano SM, Shatz CJ. Activity-dependent cortical target selection by thalamic axons. Science. 1998;281:559–562. - PubMed
    1. Cazorla M, Shegda M, Ramesh B, Harrison NL, Kellendonk C. Striatal D2 receptors regulate dendritic morphology of medium spiny neurons via Kir2 channels. J Neurosci. 2012;32:2398–2409. - PMC - PubMed

MeSH terms