Molecular fixative enables expression microarray analysis of microdissected clinical cervical specimens
- PMID: 24412268
- PMCID: PMC3988026
- DOI: 10.1016/j.yexmp.2013.12.007
Molecular fixative enables expression microarray analysis of microdissected clinical cervical specimens
Abstract
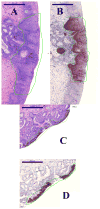
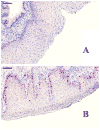
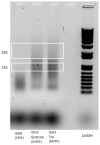
Formalin-fixed tissue has been a mainstay of clinical pathology laboratories, but formalin alters many biomolecules, including nucleic acids and proteins. Meanwhile, frozen tissues contain better-preserved biomolecules, but tissue morphology is affected, limiting their diagnostic utility. Molecular fixatives promise to bridge this gap by simultaneously preserving morphology and biomolecules, enabling clinical diagnosis and molecular analyses on the same specimen. While previous reports have broadly evaluated the use of molecular fixative in various human tissues, we present here the first detailed assessment of the applicability of molecular fixative to both routine histopathological diagnosis and molecular analysis of cervical tissues. Ten specimens excised via the loop electrosurgical excision procedure, which removes conical tissue samples from the cervix, were cut into alternating pieces preserved in either formalin or molecular fixative. Cervical specimens preserved in molecular fixative were easily interpretable, despite featuring more eosinophilic cytoplasm and more recognizable chromatin texture than formalin-fixed specimens. Immunohistochemical staining patterns of p16 and Ki-67 were similar between fixatives, although Ki-67 staining was stronger in the molecular fixative specimens. The RNA of molecular fixative specimens from seven cases representing various dysplasia grades was assessed for utility in expression microarray analysis. Cluster analysis and scatter plots of duplicate samples suggest that data of sufficient quality can be obtained from as little as 50ng of RNA from molecular fixative samples. Taken together, our results show that molecular fixative may be a more versatile substitute for formalin, simultaneously preserving tissue morphology for clinical diagnosis and biomolecules for immunohistochemistry and gene expression analysis.
Keywords: Cervical intraepithelial neoplasia; Gene expression microarray analysis; Immunohistochemistry; Microdissection; Molecular fixative.
Copyright © 2014 Elsevier Inc. All rights reserved.
Conflict of interest statement
The authors declare that there are no conflicts of interest.
Figures


Similar articles
-
Chromogenic in situ hybridization and p16/Ki67 dual staining on formalin-fixed paraffin-embedded cervical specimens: correlation with HPV-DNA test, E6/E7 mRNA test, and potential clinical applications.Biomed Res Int. 2013;2013:453606. doi: 10.1155/2013/453606. Epub 2013 Nov 24. Biomed Res Int. 2013. PMID: 24369532 Free PMC article.
-
Impact of fixative on recovery of mRNA from paraffin-embedded tissue.Diagn Mol Pathol. 2004 Jun;13(2):116-25. doi: 10.1097/00019606-200406000-00008. Diagn Mol Pathol. 2004. PMID: 15167013
-
Assessment of PAXgene Fixation on Preservation of Morphology and Nucleic Acids in Microdissected Retina Tissue.Curr Eye Res. 2017 Jan;42(1):104-110. doi: 10.3109/02713683.2016.1146777. Epub 2016 Jul 13. Curr Eye Res. 2017. PMID: 27409982
-
A novel fixative improves opportunities of nucleic acids and proteomic analysis in human archive's tissues.Diagn Mol Pathol. 2006 Jun;15(2):115-23. doi: 10.1097/00019606-200606000-00009. Diagn Mol Pathol. 2006. PMID: 16778593
-
The HOPE technique opens up a multitude of new possibilities in pathology.Rom J Morphol Embryol. 2006;47(1):15-9. Rom J Morphol Embryol. 2006. PMID: 16838052 Review.
Cited by
-
Embracing an integromic approach to tissue biomarker research in cancer: Perspectives and lessons learned.Brief Bioinform. 2017 Jul 1;18(4):634-646. doi: 10.1093/bib/bbw044. Brief Bioinform. 2017. PMID: 27255914 Free PMC article.
References
-
- Ahn WS, Bae SM, Lee JM, Namkoong SE, Han SJ, Cho YL, Nam GH, Seo JS, Kim CK, Kim YW. Searching for pathogenic gene functions to cervical cancer. Gynecol Oncol. 2004;93:41–48. - PubMed
-
- Chen Y, Miller C, Mosher R, Zhao X, Deeds J, Morrissey M, Bryant B, Yang D, Meyer R, Cronin F, Gostout BS, Smith-McCune K, Schlegel R. Identification of cervical cancer markers by cDNA and tissue microarrays. Cancer Res. 2003;63:1927–1935. - PubMed
-
- Dotti I, Bonin S, Basili G, Nardon E, Balani A, Siracusano S, Zanconati F, Palmisano S, De Manzini N, Stanta G. Effects of formalin, methacarn, and fineFIX fixatives on RNA preservation. Diagn Mol Pathol. 2010;19:112–122. - PubMed
Publication types
MeSH terms
Substances
Grants and funding
LinkOut - more resources
Full Text Sources
Other Literature Sources
Medical
Miscellaneous

