. 2014 Jan 30;6(2):366-76.
doi: 10.1016/j.celrep.2013.12.029. Epub 2014 Jan 9.

Critical role for mast cell Stat5 activity in skin inflammation

Affiliations

Critical role for mast cell Stat5 activity in skin inflammation

Tomoaki Ando et al. Cell Rep. .

Abstract

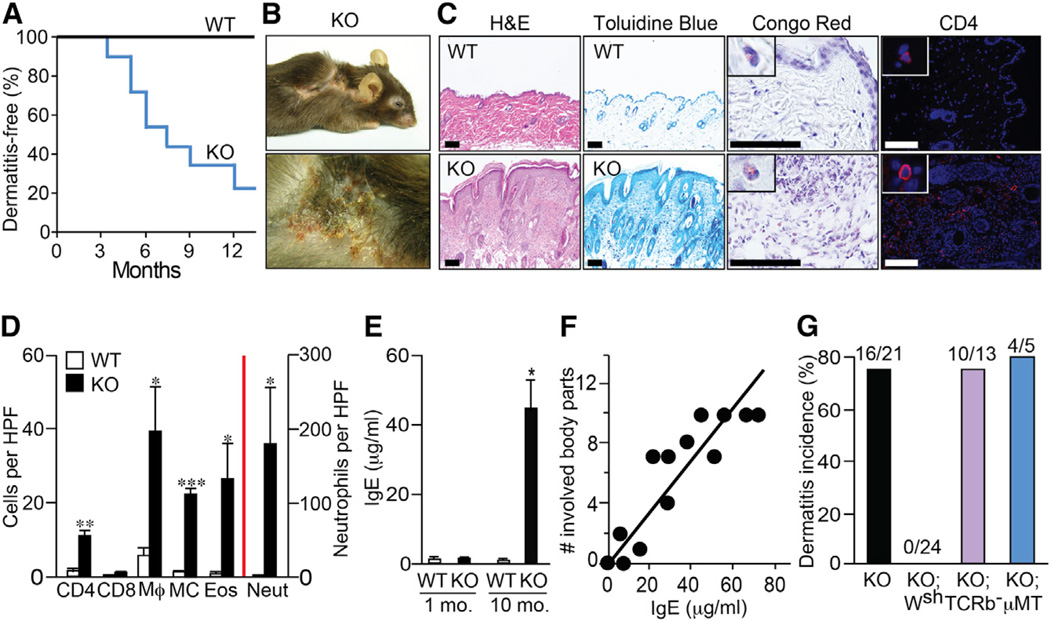
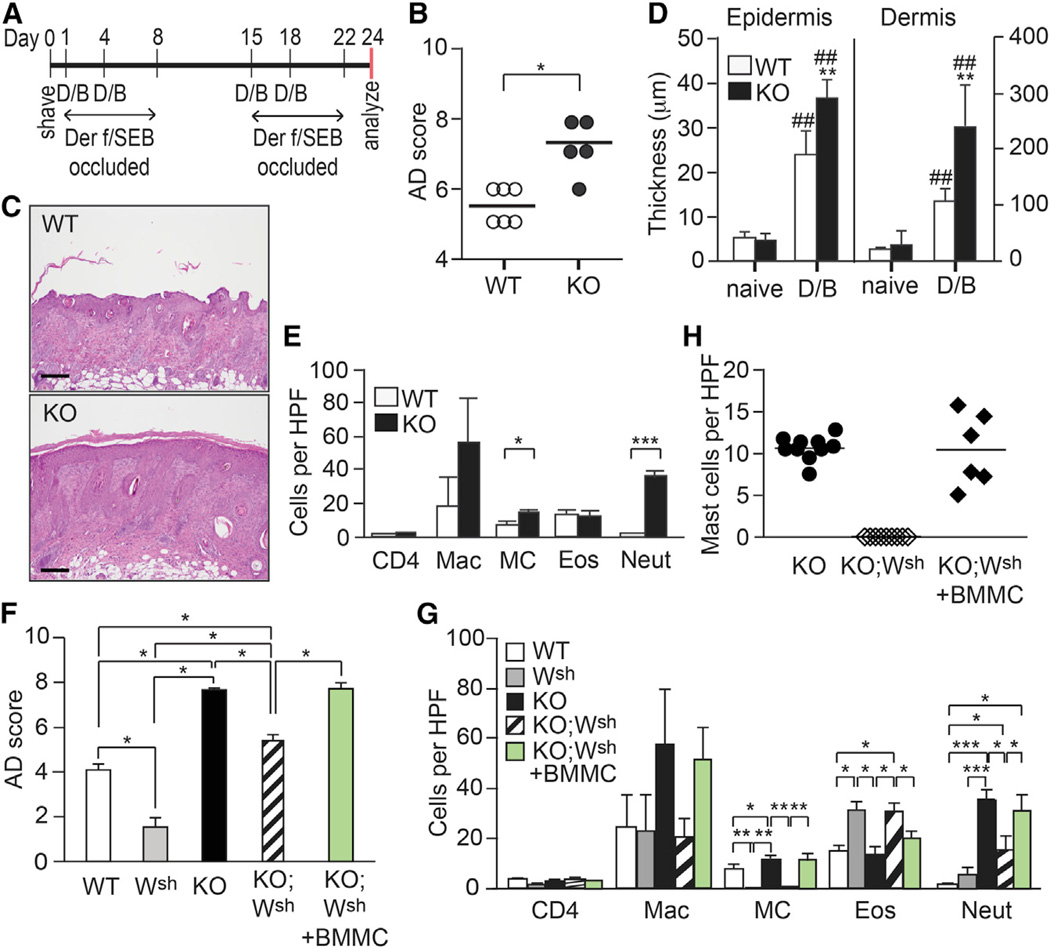
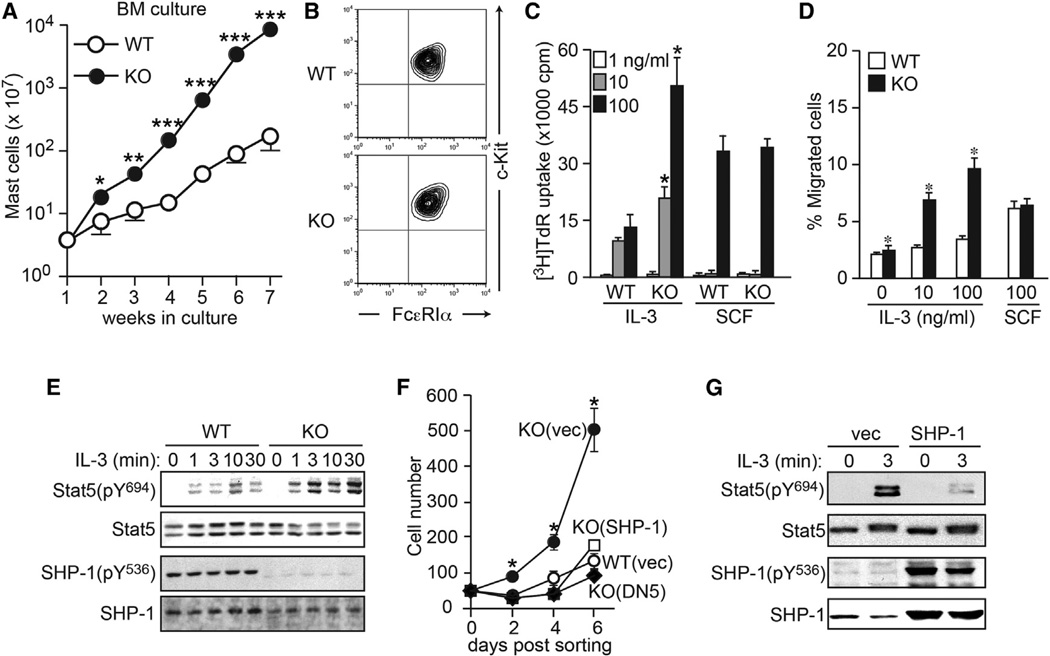
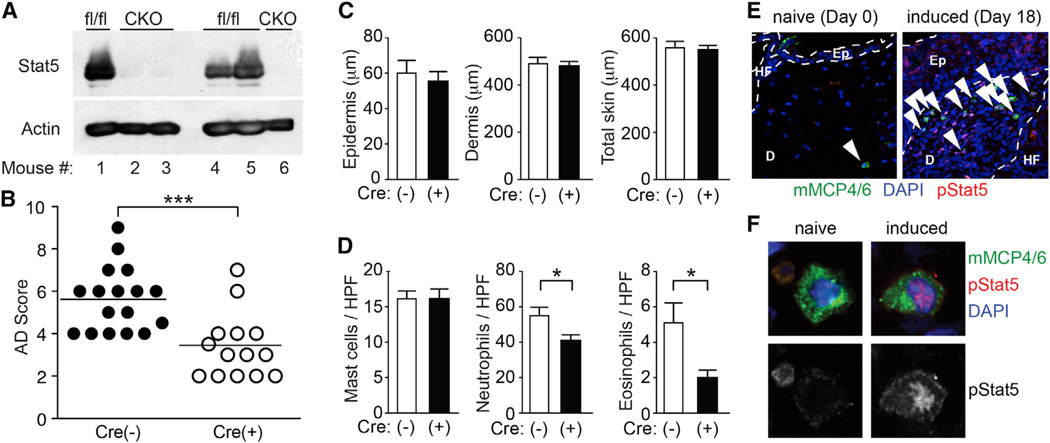
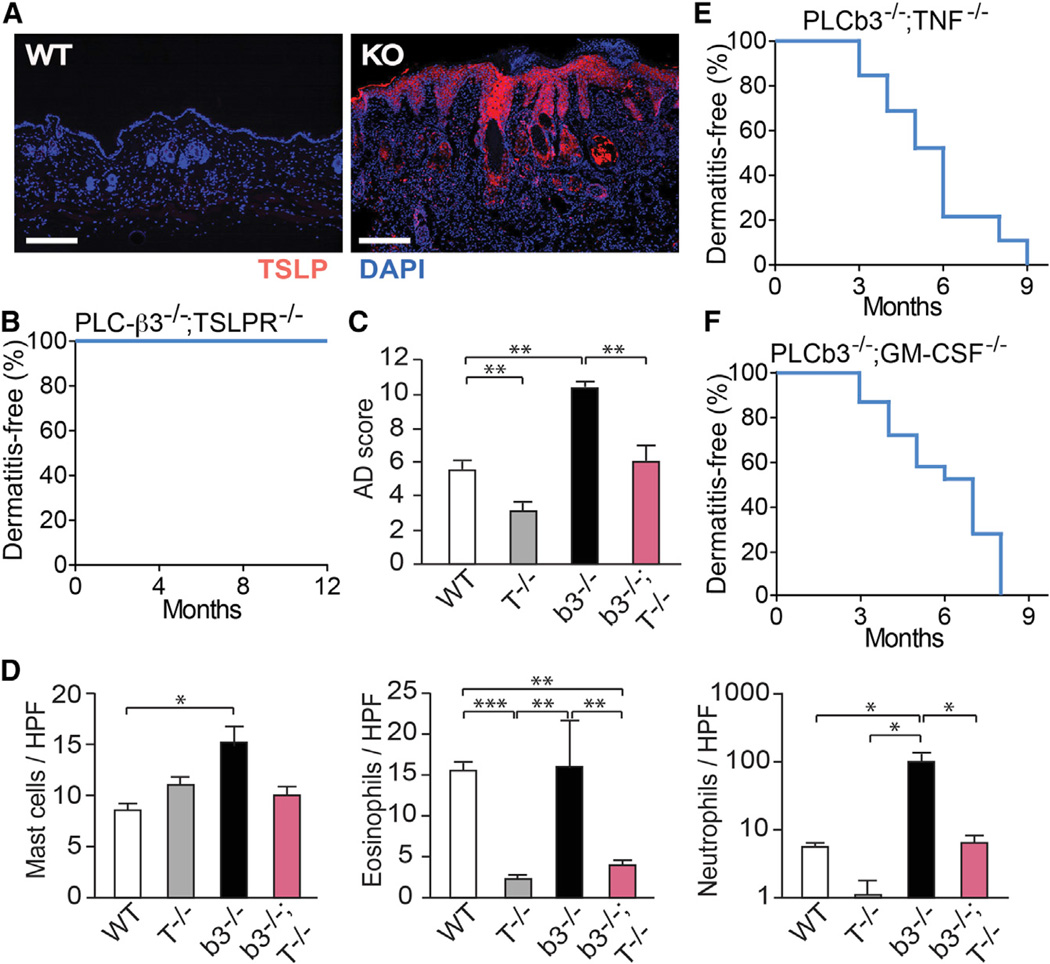
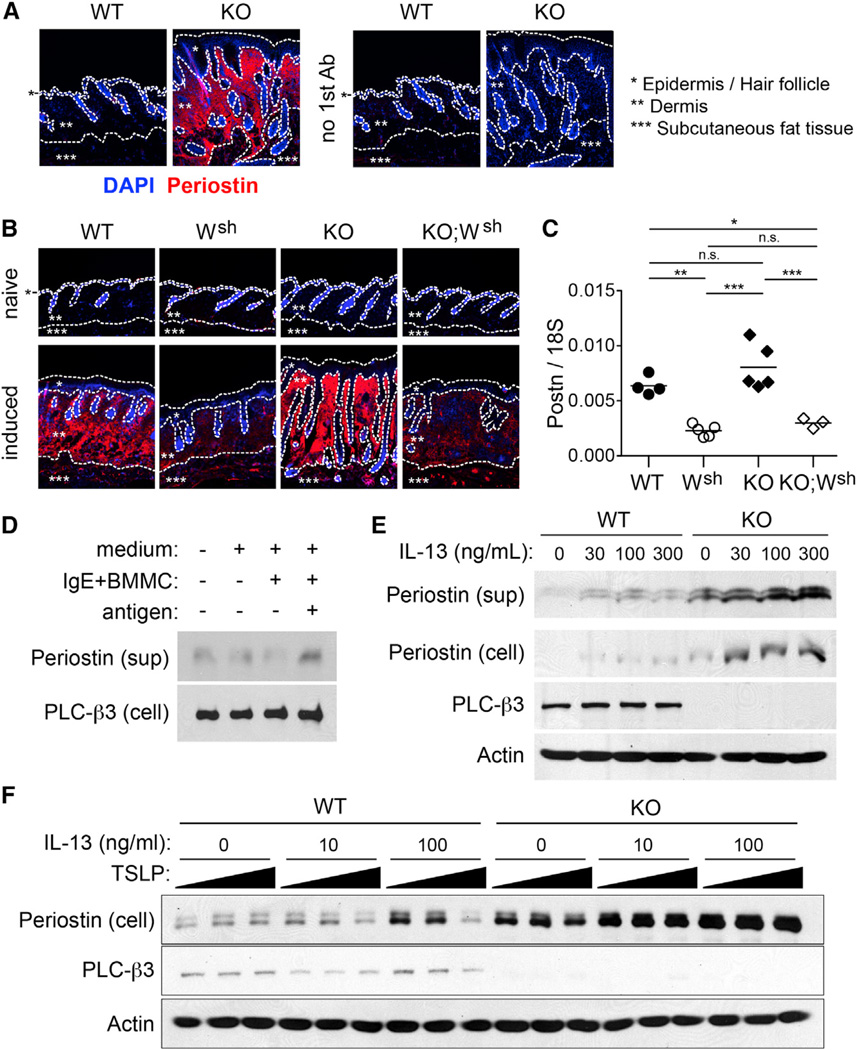
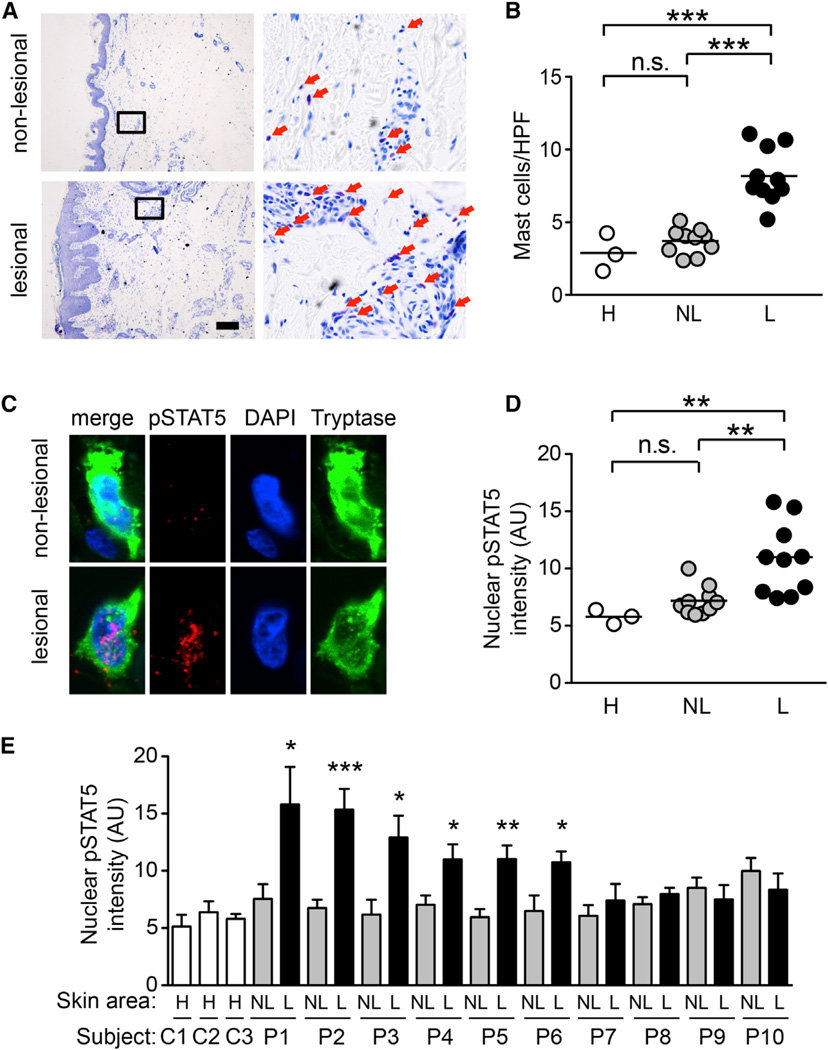
Atopic dermatitis (AD) is a chronic inflammatory skin disease. Here, we show that phospholipase C-β3 (PLC-β3)-deficient mice spontaneously develop AD-like skin lesions and more severe allergen-induced dermatitis than wild-type mice. Mast cells were required for both AD models and remarkably increased in the skin of Plcb3(-/-) mice because of the increased Stat5 and reduced SHP-1 activities. Mast cell-specific deletion of Stat5 gene ameliorated allergen-induced dermatitis, whereas that of Shp1 gene encoding Stat5-inactivating SHP-1 exacerbated it. PLC-β3 regulates the expression of periostin in fibroblasts and TSLP in keratinocytes, two proteins critically involved in AD pathogenesis. Furthermore, polymorphisms in PLCB3, SHP1, STAT5A, and STAT5B genes were associated with human AD. Mast cell expression of PLC-β3 was inversely correlated with that of phospho-STAT5, and increased mast cells with high levels of phospho-STAT5 were found in lesional skin of some AD patients. Therefore, STAT5 regulatory mechanisms in mast cells are important for AD pathogenesis.


Figures

Figure 1
Figure 1. Plcb3−/− Mice Spontaneously Develop AD-like Skin Lesions in a Mast Cell-Dependent Manner
(A) Kaplan-Meier plots for dermatitis development in Plcb3−/− mice (n = 21). (B) Note the eczematous skin lesions and hair loss in periocular areas, cheeks, ears, neck, and flanks in a 10-month-old Plcb3−/− mouse. (C) Histology of healthy (WT) and skin lesions (Plcb3−/−) in ear. Scale bar, 100 µm. (D) Graphic representation of histological analysis of ear skin lesions of 8- to 10-month-old WT and Plcb3−/− mice. Neutrophils (Neut), eosinophils (Eos), and mast cells (MC) were enumerated in H&E-, Congo-red- and Toluidine-blue-stained preparations, respectively. Immunofluorescence staining was performed to detect CD4+, CD8+, and F4/80+ (Mϕ) cells. Data represent mean ± SEM. *p < 0.05, **p < 0.01, ***p < 0.001 versus WT mice by Student’s t test. Similar results were obtained in lesional skin in cheeks and neck (data not shown). HPF, high-power field. (E) Serum IgE levels were increased in 8- to 10-month-old Plcb3−/− mice. Data represent mean ± SEM. (F) Correlation between serum IgE levels and numbers of body parts with skin lesions (see the legend for B for eczematous body parts). r2 = 0.78, p < 0.0001, Pearson’s correlation. (G) Incidence of skin lesions in Plcb3−/− (KO), Plcb3−/−;KitW-sh/W-sh (KO;Wsh), Plcb3−/−;TCRb−/− (KO;TCRb) and Plcb3−/−;µMT/µMT (KO;µMT) mice for 12 months. Results in (E) and (F) are representative of two independent experiments using three to six mice per group. See also Figure S1.
Figure 2
Figure 2. Mast Cells Significantly Contribute to the Increased Severity of Der f/SEB-Induced Skin Lesions in Plcb3−/− Mice
(A) AD-like skin lesions were induced as described previously (Kawakami et al., 2007). D/B, treatment with Der f and SEB. The periods when Der f/SEB-treated back skin is occluded with Tegaderm are also shown. (B) AD scores on day 24 with WT and Plcb3−/− mice. (C) H&E staining of lesional skins in WT and Plcb3−/− (KO) mice. (D) Thicknesses of epidermis and dermis at basal and Der f/SEB (D/B)-treated levels were measured on H&E-stained lesional skins. Results in (B)–(D) are representative of three independent experiments using five to eight mice per group. (E) Histologic analysis of Der f/SEB-induced dermatitis. (F and G) Dermatitis was induced in WT, KitW-sh/W-sh (Wsh), Plcb3−/− (KO) and Plcb3−/−;KitW-sh/W-sh (KO;Wsh) mice. A group of Plcb3−/−;KitW-sh/W-sh mice received BMMCs derived from Plcb3−/− mice 6 weeks before Der f/SEB treatment. (F) AD scores on day 24. (G) Histologic analysis of dermatitis. Data represent mean ± SD. *p < 0.05, **p < 0.01, ***p < 0.001 versus WT mice or indicated pairs by Student’s t test or ANOVA; ##, p < 0.01 versus naive mice. (H) Mast cells were quantified on Toluidine-blue-stained skin tissues. HPF, high-power field. Results in (F)–(H) are representative of two independent experiments using six mice per group. See also Figure S2.
Figure 3
Figure 3. Plcb3−/− Mast Cells Are Hypersensitive to IL-3 Stimulation
(A) Bone marrow cells derived from WT or Plcb3−/− mice were cultured in IL-3-containing medium for the indicated periods. Live cells were counted. (B) Greater than 98% of 5 week cultured BMMCs expressed c-Kit and FcεRI. Results in (A) and (B) are representative of at least ten experiments using three to four mice per group. (C) BMMCs were depleted of IL-3 for 8 hr and cultured in the indicated concentrations of IL-3 or SCF for 36 hr. DNA synthesis was measured by [3H]thymidine incorporation during the last 18 hr of culture. (D) Chemotaxis of BMMCs toward IL-3 or SCF was assayed in Transwell for 8 hr. Results in (C) and (D) are representative of two experiments using three mice per group. (E) WT and Plcb3−/− BMMCs were stimulated with 10 ng/ml of IL-3 for the indicated periods. Cell lysates were analyzed by SDS-PAGE followed by western blotting using antibodies for the indicated molecules. (F and G) WT and Plcb3−/− MCPs were transduced with bicistronic retroviral vectors coding for DN Stat5 (DN5), WT SHP-1, or empty vector. GFP+-transduced cells were FACS-sorted and cultured in IL-3 (F). *p < 0.05 versus empty vector-transduced WT cells (WT [vec]) by Student’s t test. Some transduced Plcb3−/− mast cells were stimulated with IL-3 and subjected to western blot analysis (G). Results in (E)–(G) are representative of two transduction experiments. In (A), (C), (D), and (F), data represent mean ± SEM. See also Figure S3.
Figure 4
Figure 4. Stat5 in Mast Cells Regulates Der f/SEB-Induced Dermatitis
Dermatitis was induced with Der f/SEB in MCΔStat5 mice [CKO or Cre(+)] and their floxed control [fl/fl or Cre()] mice. *p < 0.05, ***p < 0.001 by Student’s t test. (A) Western blot analysis of Stat5 in mast cells derived from neonatal skin of MCΔStat5 (CKO) and control (fl/fl) mice. (B) AD scores accumulated from four separate experiments using three to five mice per group. (C) Thicknesses of epidermis and dermis after Der f/SEB (D/B) treatment. (D) Histologic analysis of Der f/SEB-induced dermatitis. Data represent mean ± SEM. (E and F) Skin sections of naive and Der f/SEB-induced (6 hr after fourth induction) dermatitis in WT mice were stained for phospho-Stat5, mMCP4, and mMCP6. Arrowheads indicate pStat5-positive mast cells. Ep, epidermis; D, dermis; HF, hair follicle. Representative images of mast cells from three experiments are shown in (E) and (F). See also Figure S4.
Figure 5
Figure 5. Role of the TSLP-TSLPR Axis in Der f/SEB-Induced Dermatitis and Spontaneous Dermatitis in Plcb3−/− Mice
(A) Lesional skin from 10-month-old Plcb3−/− mice and healthy control (WT) were stained for TSLP (red) and nuclei (blue). (B) Kaplan-Meier plots for dermatitis development in Plcb3−/−;TSLPR−/− (n = 10). (C) Dermatitis was induced with Der f/SEB in WT, TSLPR−/− (T−/−), Plcb3−/− (b3−/−), and Plcb3−/−;TSLPR−/− (b3−/−;T−/−) mice. (D) Histologic analysis of Der f/SEB-induced dermatitis. Data represent mean ± SEM. (E and F) Kaplan-Meier plots for dermatitis development in Plcb3−/−;TNF−/− (n = 34), and Plcb3−/−;GM-CSF−/− (n = 31) mice. Results in (C) and (D) are representative of two independent experiments using three to six mice per group. *p < 0.05, **p < 0.01, ***p < 0.001 by ANOVA. See also Figure S5.
Figure 6
Figure 6. Regulation of Periostin Production in Fibroblasts
(A) Lesional skin of spontaneous dermatitis in Plcb3−/− mice (KO) and normal skin from WT mice (WT) were stained for periostin (red) and nuclei (blue). Right panels show control stainings without antiperiostin antibody. (B) Periostin was stained before (naive) and after Der f/SEB induction of dermatitis (induced) in WT, KitW-sh/W-sh (Wsh), Plcb3−/− (KO), and Plcb3−/−;KitW-sh/W-sh (KO;Wsh) mice. Borders of epidermis, dermis and subcutaneous fat tissues are indicated by dotted lines. (C) Periostin mRNA expression in Der f/SEB-treated skin was quantified by qPCR. (D) NIH/3T3 cells were incubated with or without IgE-sensitized BMMCs in the presence or absence of antigen. (E and F) WT and Plcb3−/− MEFs were stimulated by the indicated concentrations of IL-13 in the absence (E) or presence (F) of 0, 10, or 100 ng/ml of TSLP for 24 hr. Results in (A)–(C) are representative of three experiments using three to five mice per group. Periostin protein in culture supernatants and lysates of the cells was analyzed by western blotting. *p < 0.05, **p < 0.01, ***p < 0.001 by ANOVA. In vitro experiments with results similar to (D)–(F) were performed two to four times. See also Figure S7.
Figure 7
Figure 7. Increased Numbers of Mast Cells with Enhanced STAT5 Phosphorylation in Human AD Patients
(A) Lesional and nonlesional skin samples of human AD patients were analyzed by Toluidine blue staining. Portions indicated by rectangle are enlarged on right panels. Red arrows indicate mast cells. (B) Quantification of mast cells. **p < 0.01; ***p < 0.001 by Tukey’s multiple comparison test (ANOVA). (C) Skin samples of human AD patients were stained for phospho-STAT5 (red), tryptase (green), and nuclei (blue). Representative images are shown from patient P1. (D and E) Nuclear phospho-STAT5 levels in mast cells in lesional (L) and nonlesional (NL) skin samples of human AD patients and healthy skin (H) were measured by ImageJ software (NIH). Data represent mean ± SEM. *p < 0.05, **p < 0.01, ***p < 0.001 versus nonlesional (NL) skin by Student’s t test. See also Figure S6 and Tables S1–S4.

References

    1. Allakhverdi Z, Comeau MR, Jessup HK, Yoon BR, Brewer A, Chartier S, Paquette N, Ziegler SF, Sarfati M, Delespesse G. Thymic stromal lymphopoietin is released by human epithelial cells in response to microbes, trauma, or inflammation and potently activates mast cells. J. Exp. Med. 2007;204:253–258. - PMC - PubMed
    1. Ando T, Matsumoto K, Namiranian S, Yamashita H, Glatthorn H, Kimura M, Dolan BR, Lee JJ, Galli SJ, Kawakami Y, et al. Mast cells are required for full expression of allergen/SEB-induced skin inflammation. J. Invest. Dermatol. 2013;133:2695–2705. - PMC - PubMed
    1. Arinobu Y, Iwasaki H, Gurish MF, Mizuno S, Shigematsu H, Ozawa H, Tenen DG, Austen KF, Akashi K. Developmental checkpoints of the basophil/mast cell lineages in adult murine hematopoiesis. Proc. Natl. Acad. Sci. USA. 2005;102:18105–18110. - PMC - PubMed
    1. Beck LA, Boguniewicz M, Hata T, Schneider LC, Hanifin J, Gallo R, Paller AS, Lieff S, Reese J, Zaccaro D, et al. Phenotype of atopic dermatitis subjects with a history of eczema herpeticum. J. Allergy Clin. Immunol. 2009;124:260–269. e1–e7. - PMC - PubMed
    1. Bieber T. Atopic dermatitis. N. Engl. J. Med. 2008;358:1483–1494. - PubMed

Publication types

Substances